FinVolution Group's management explains the business in its own materials. The slides below do the most of that work, pulled from the documents preserved in Sources. Each source link opens the complete presentation at that slide in a new tab.
The newest and fullest deck: the three-country franchise, the growth strategy, the operating engine, risk and capital returns — a company overview in one document. · Open the full document →
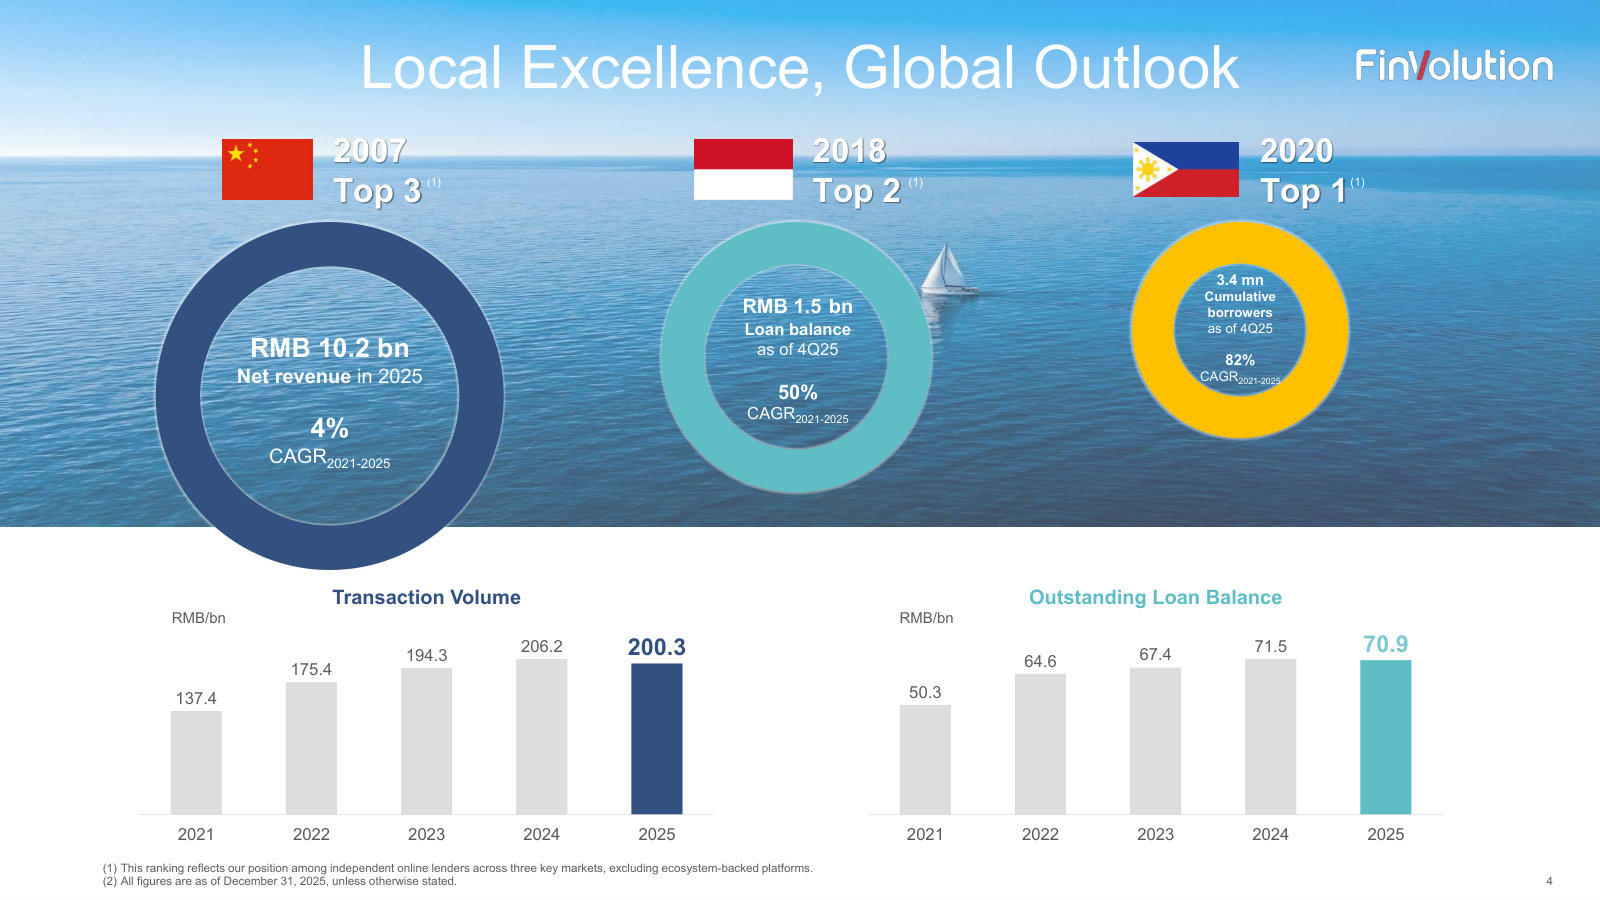
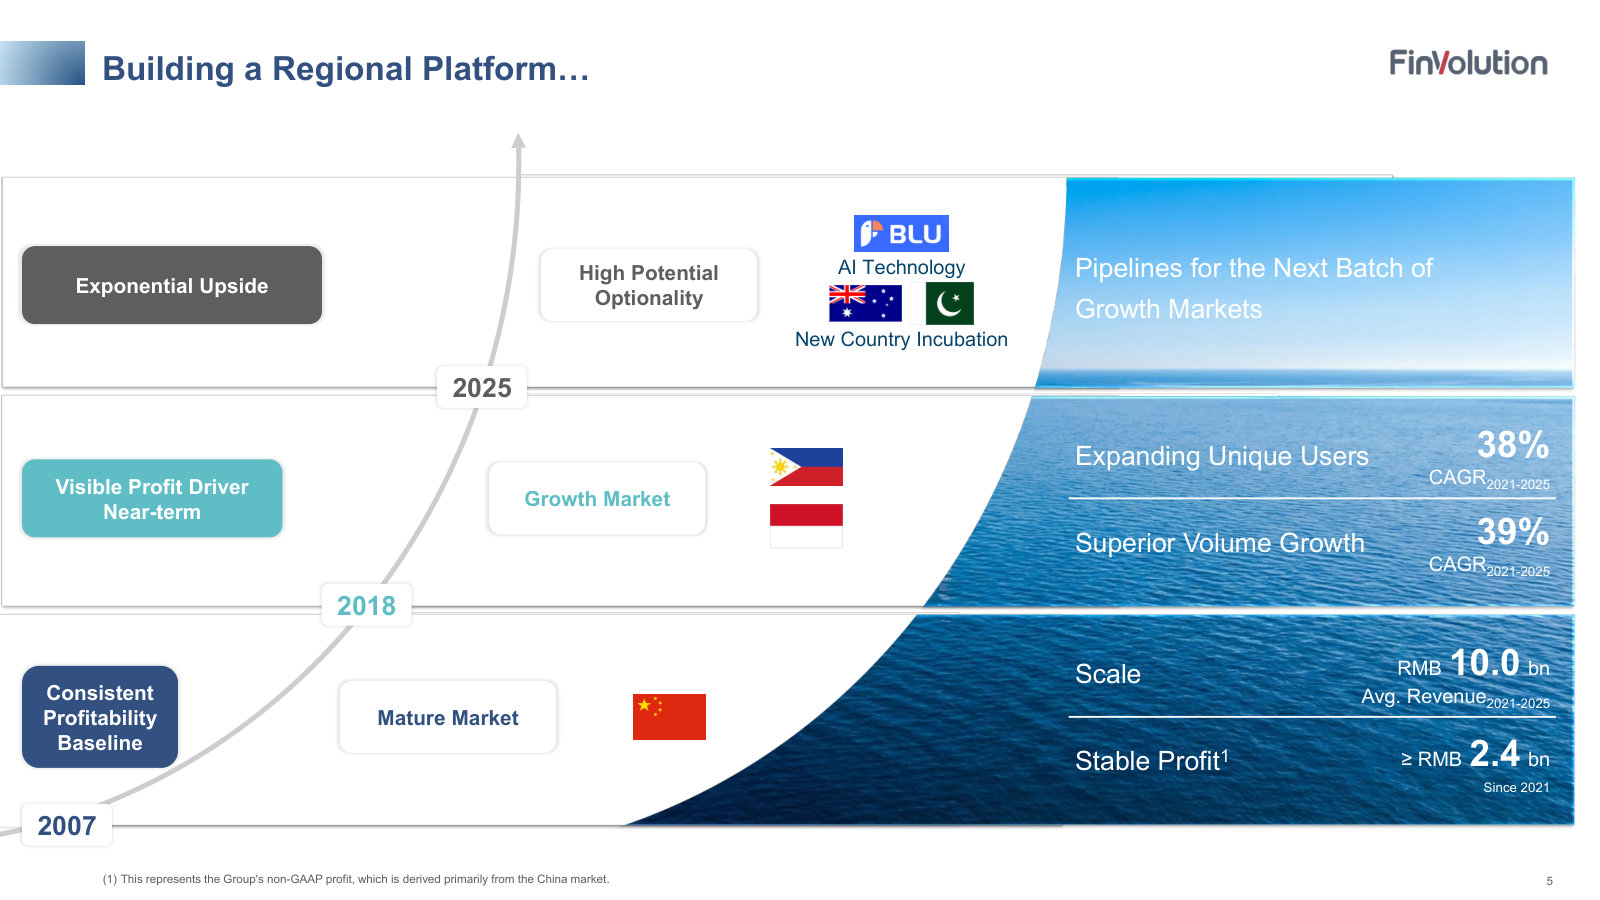
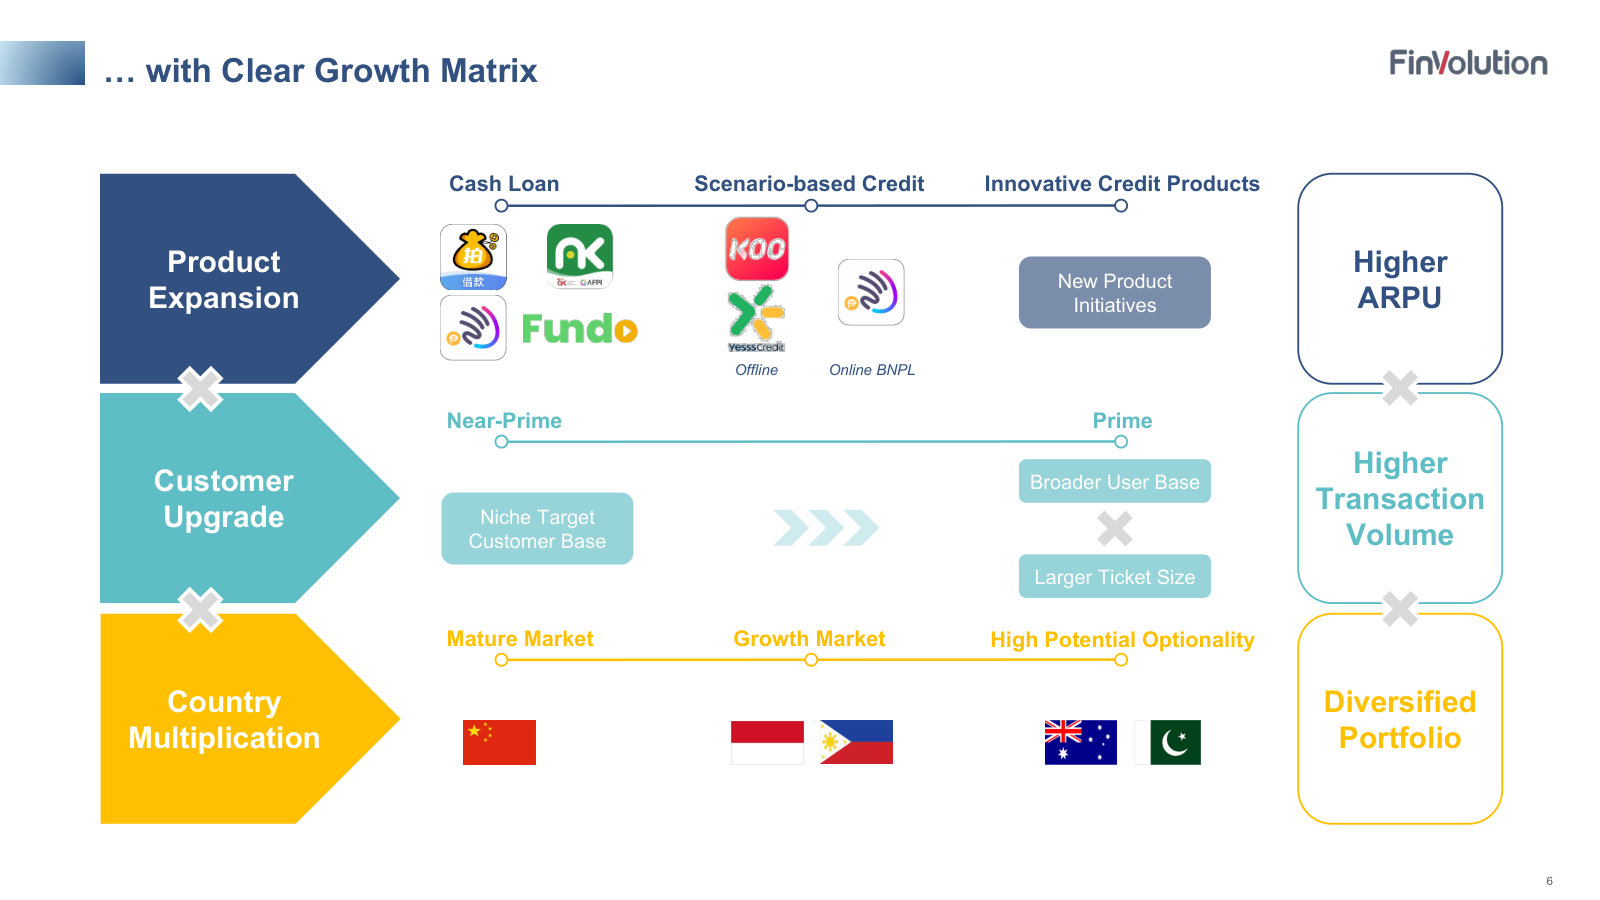
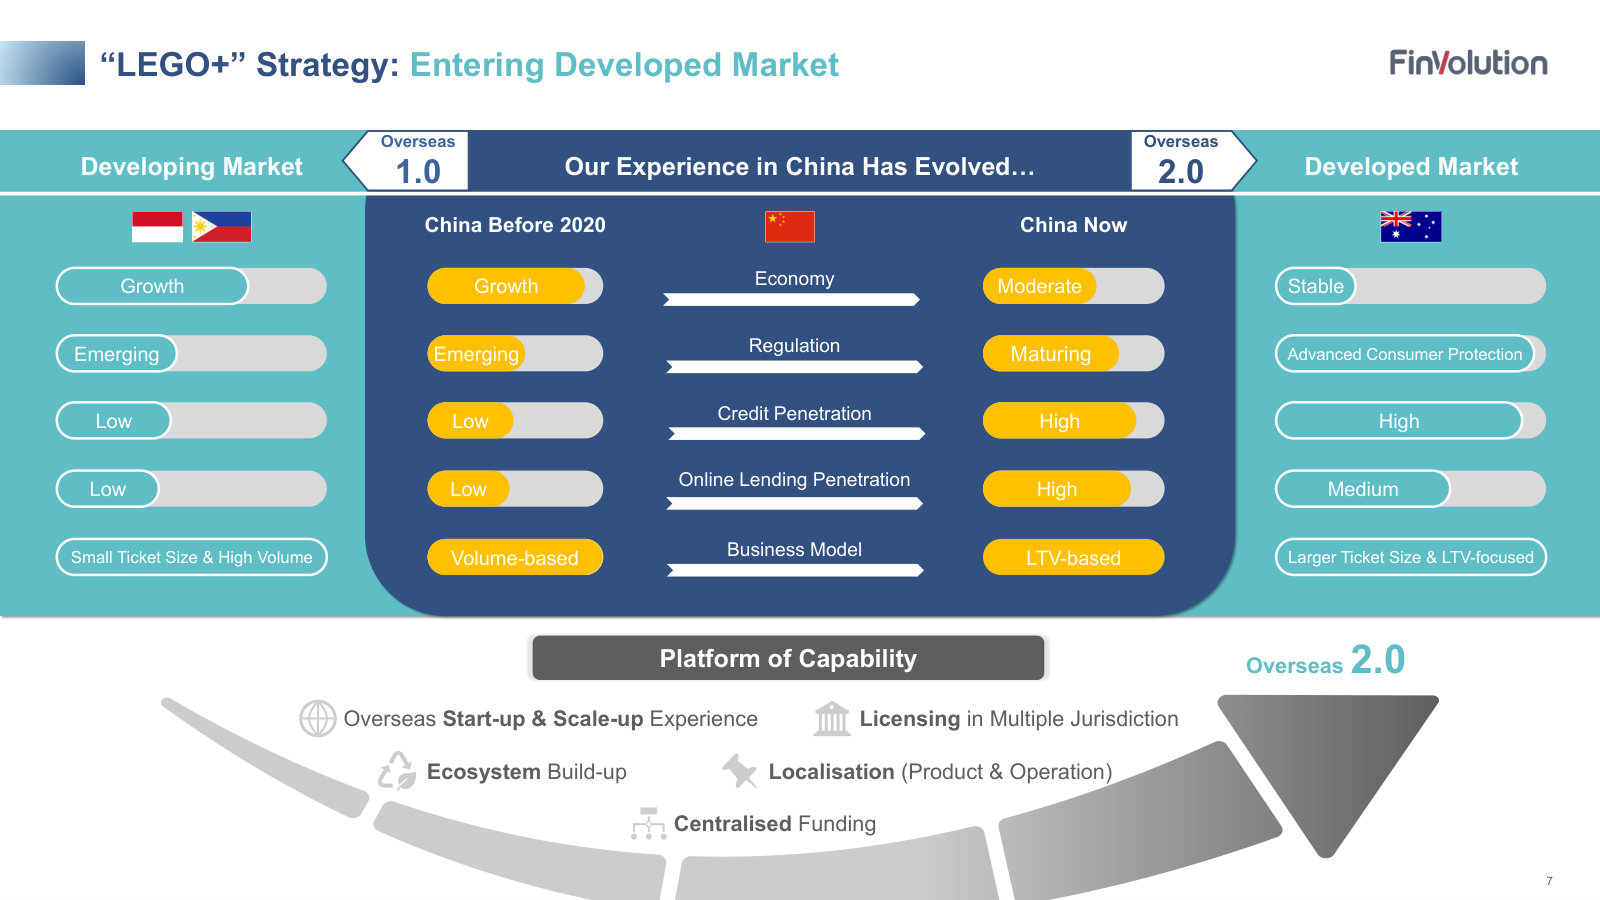
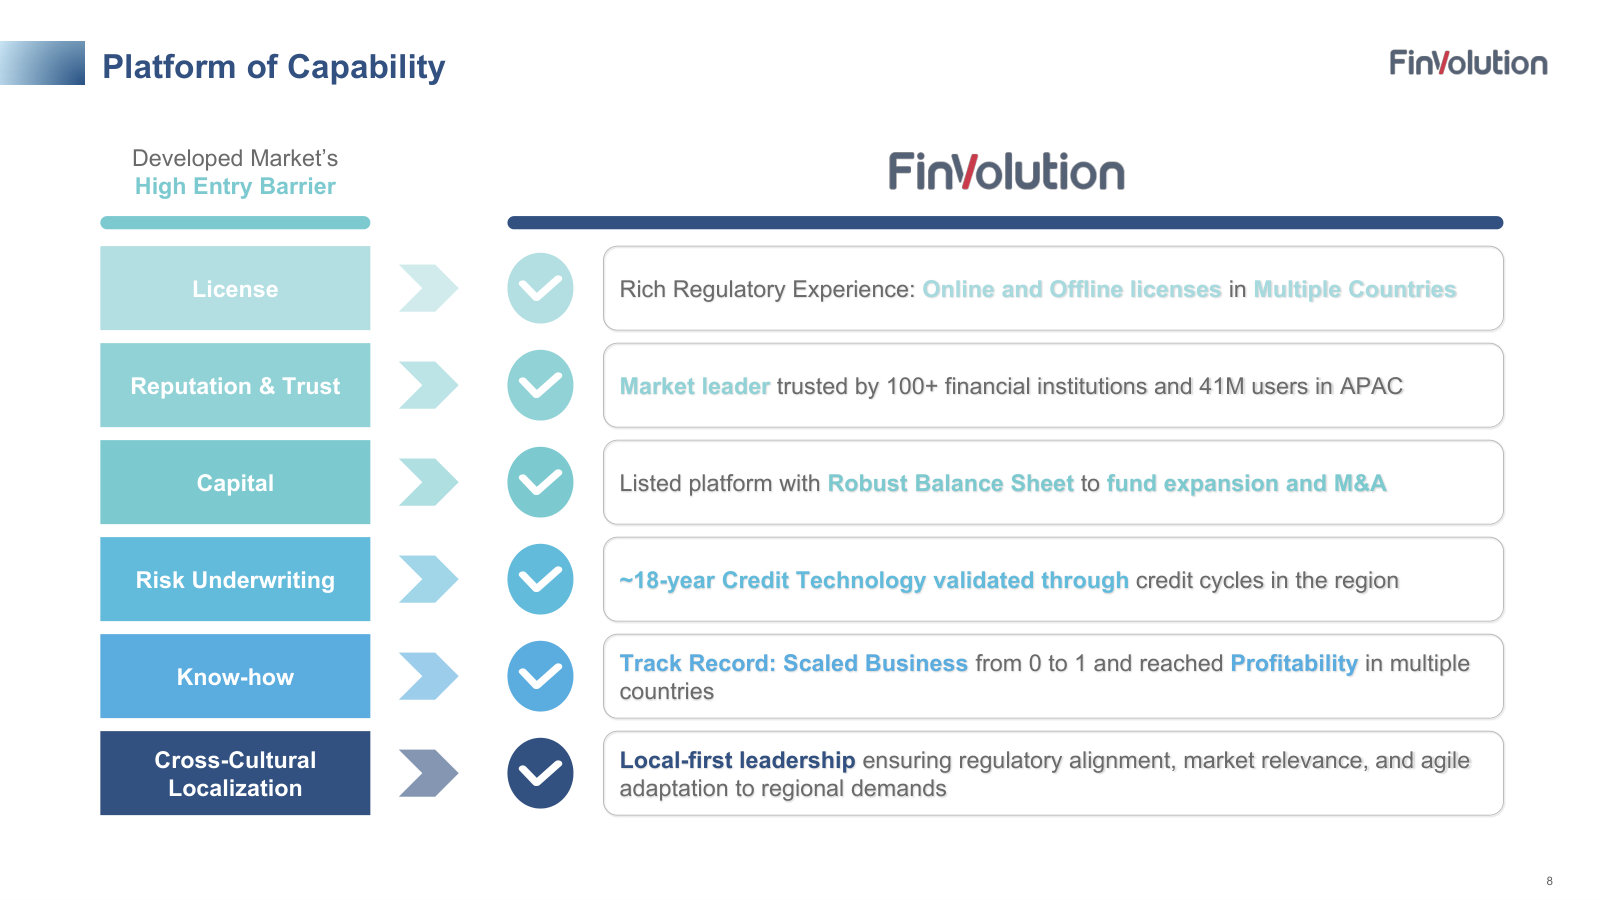
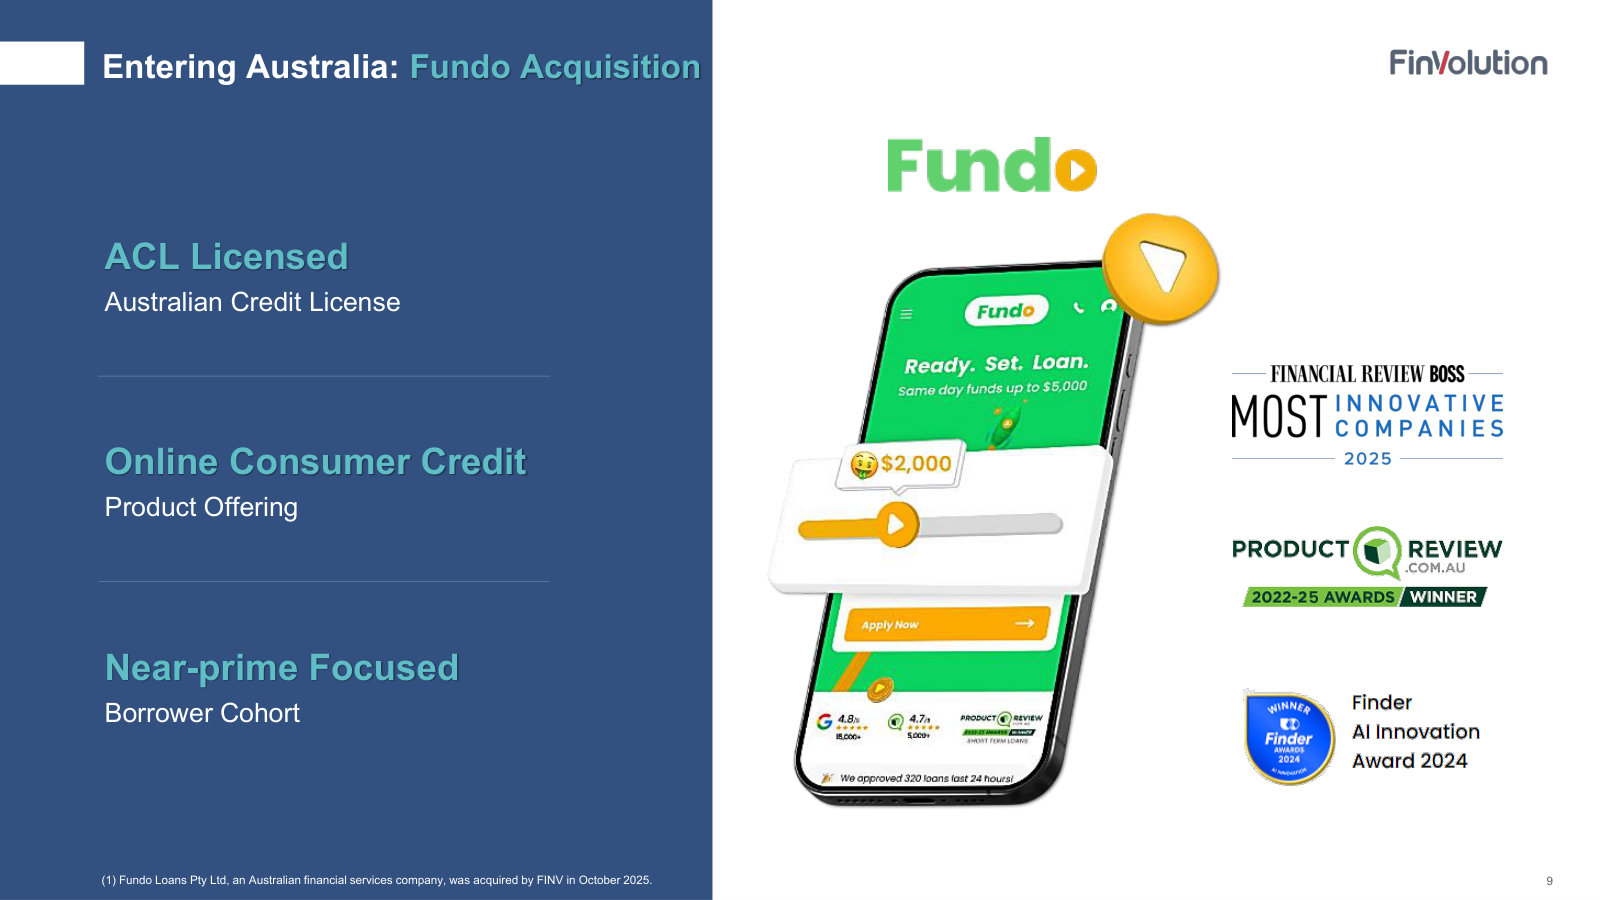
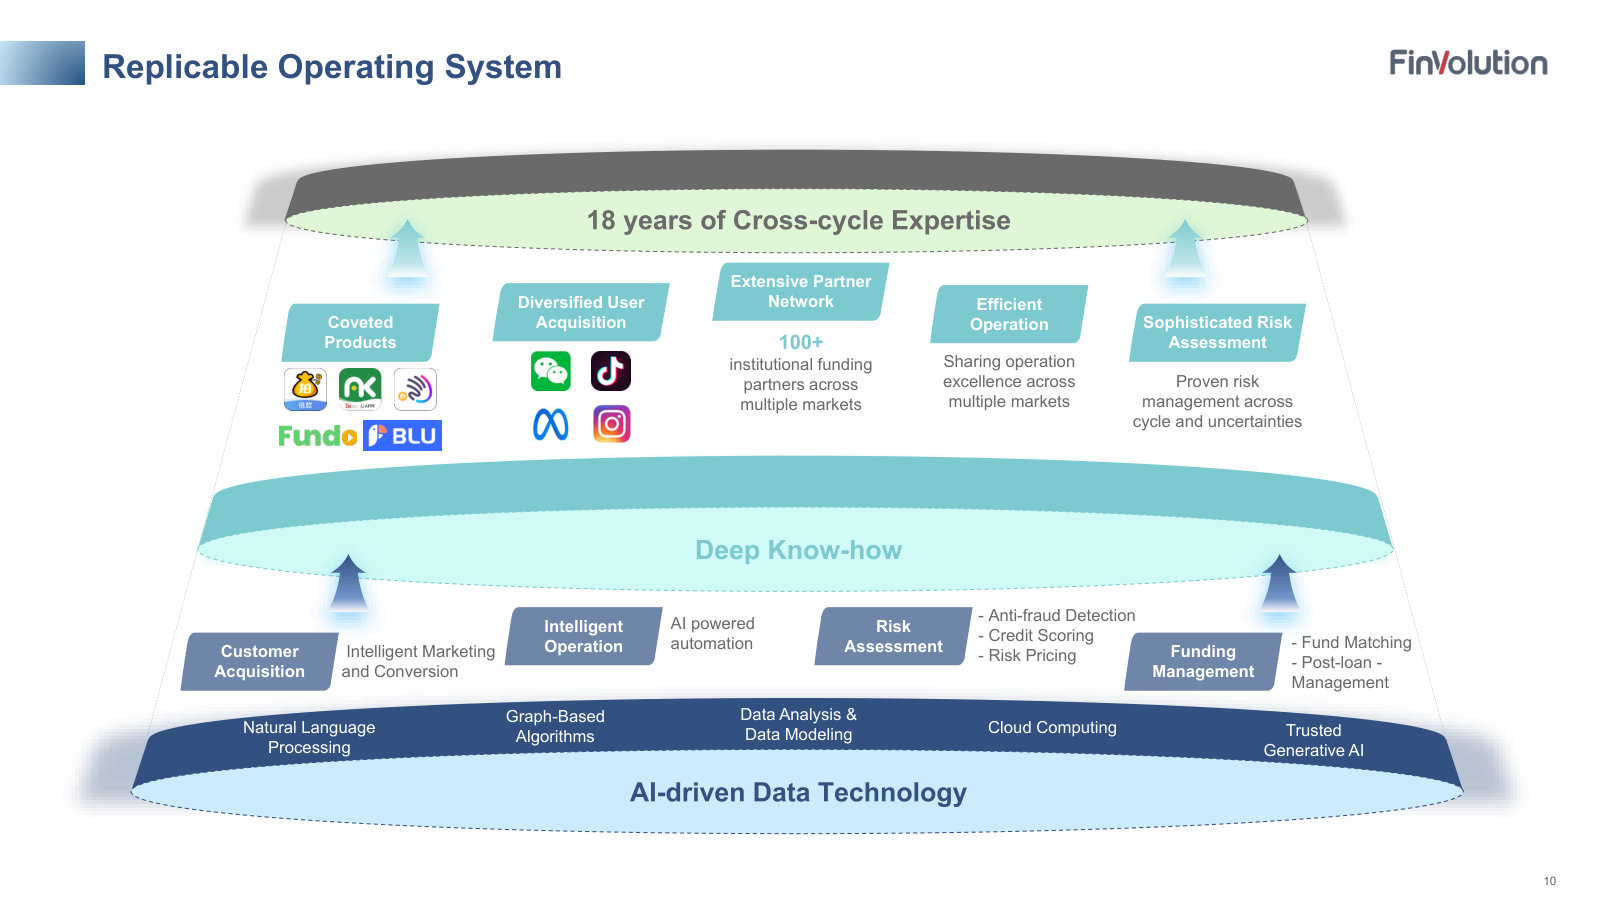
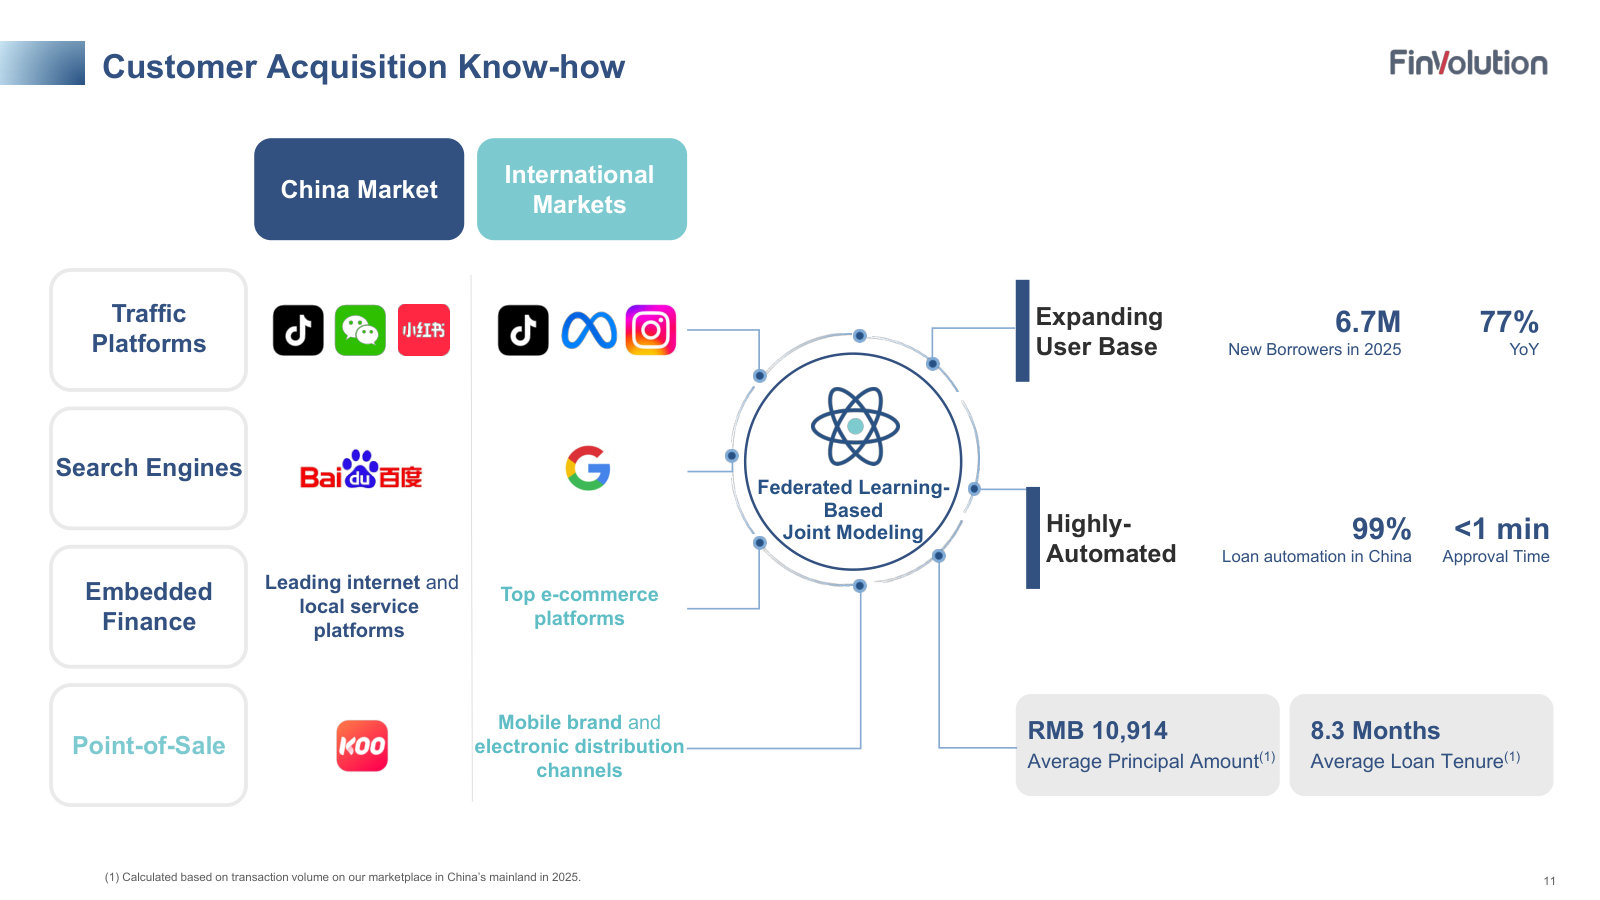
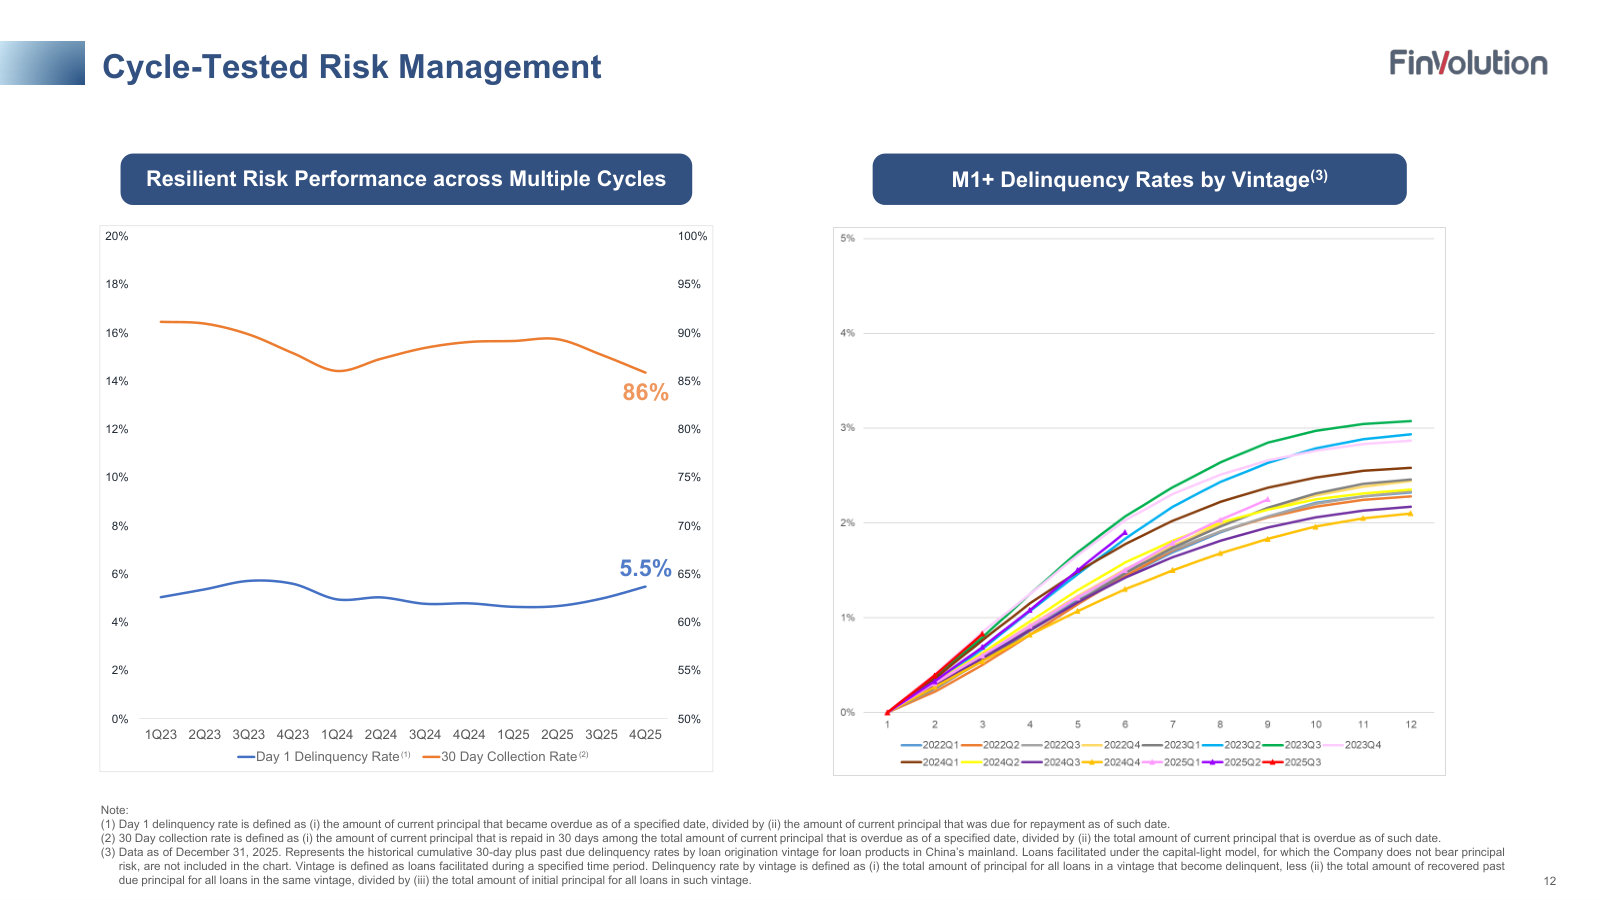
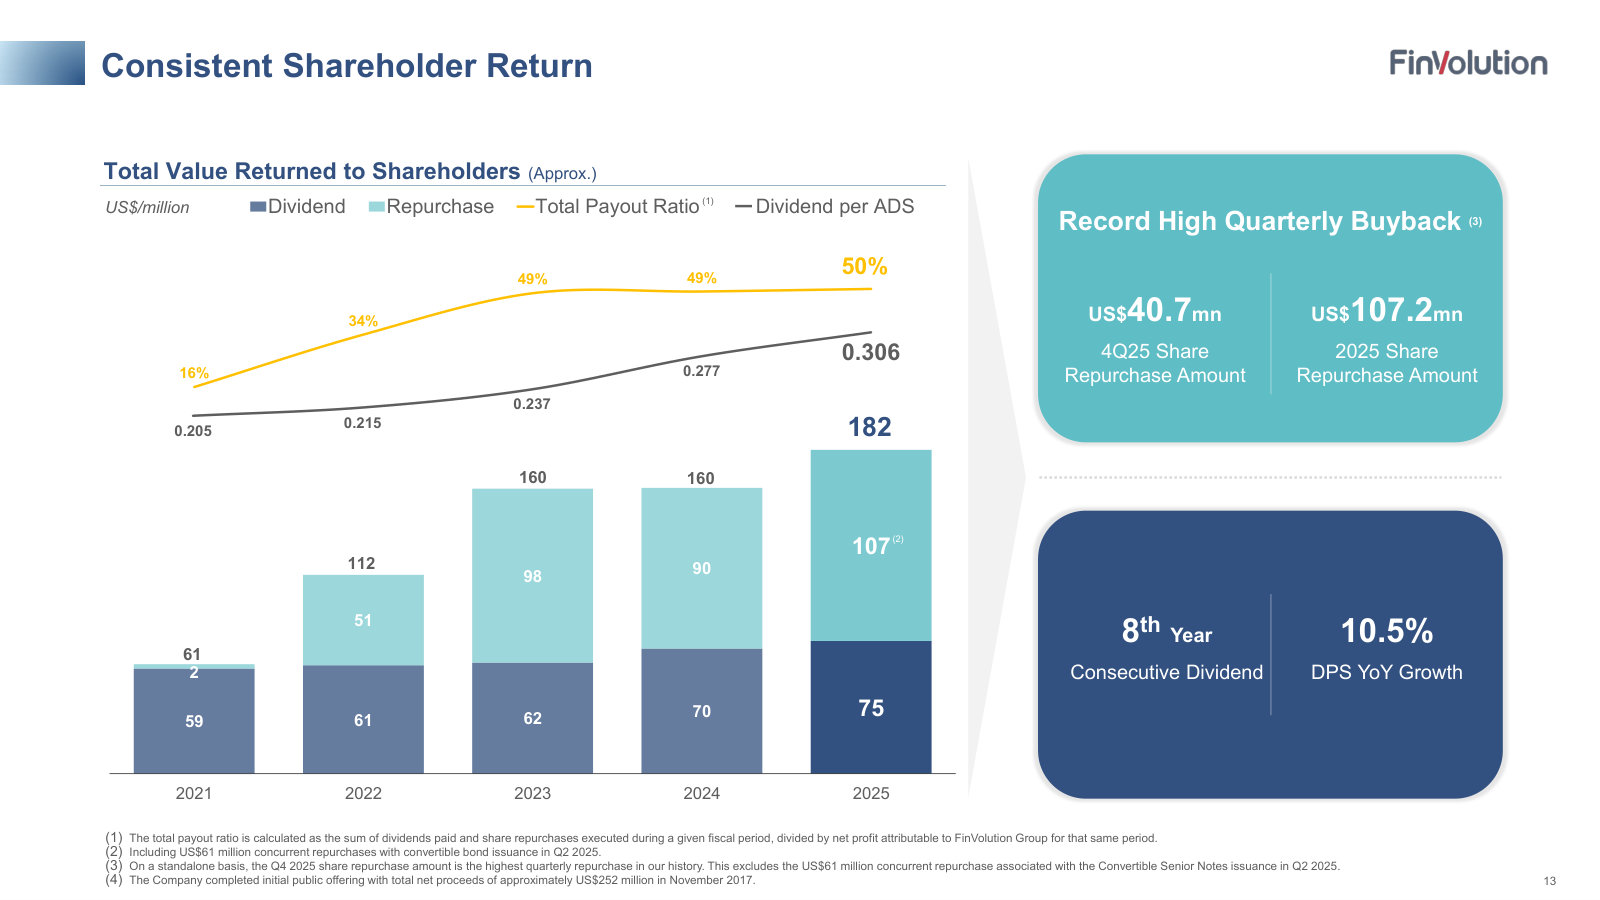
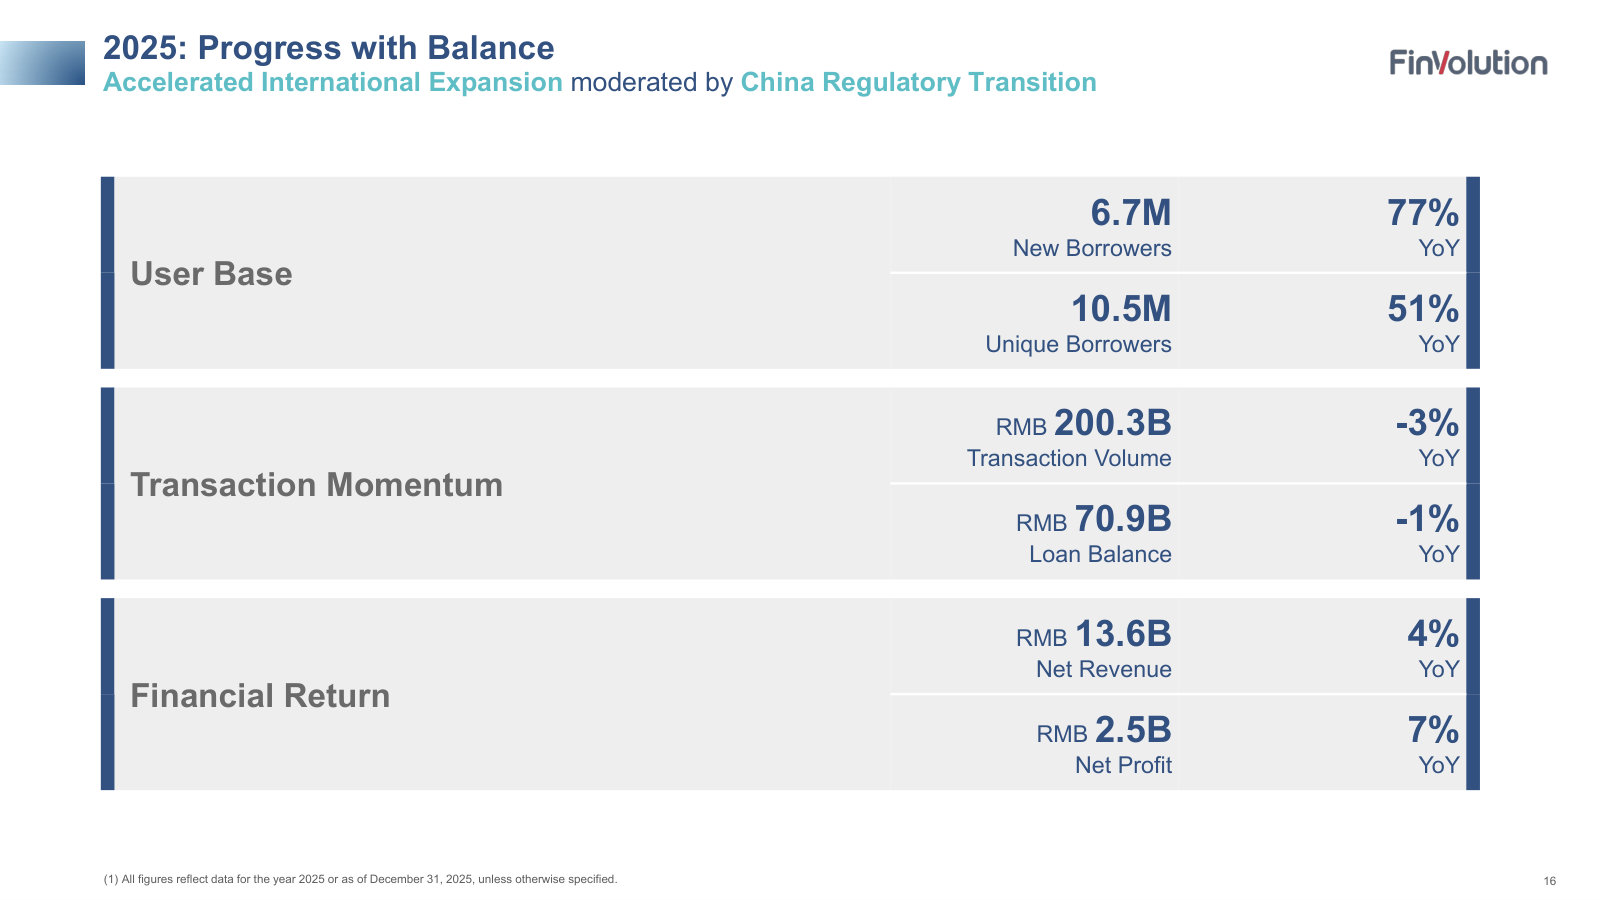
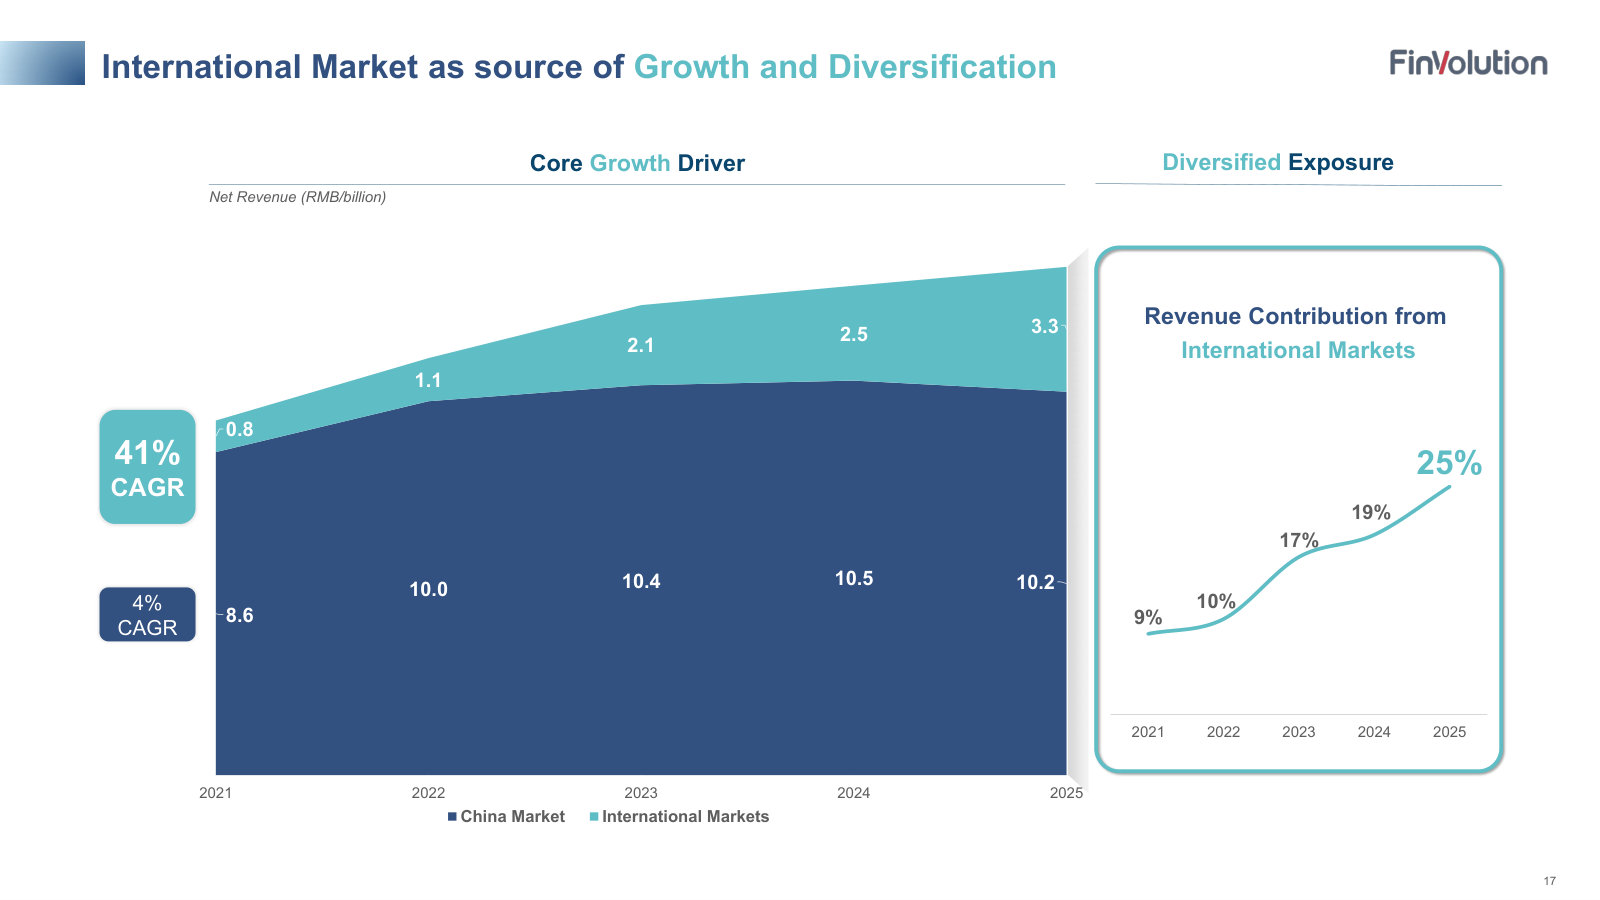
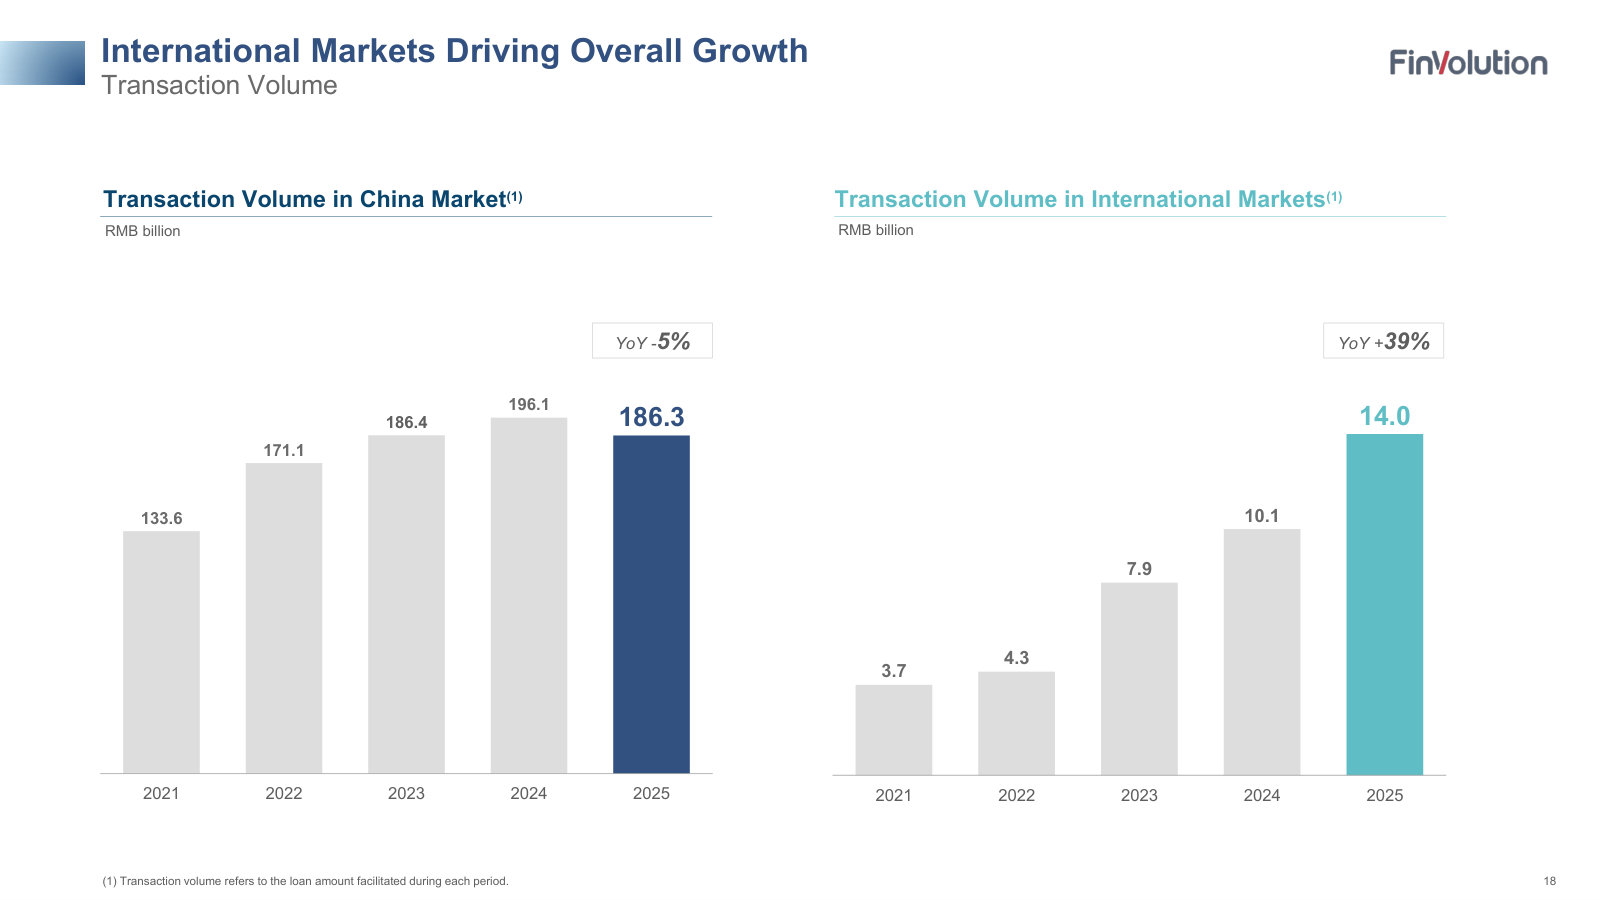
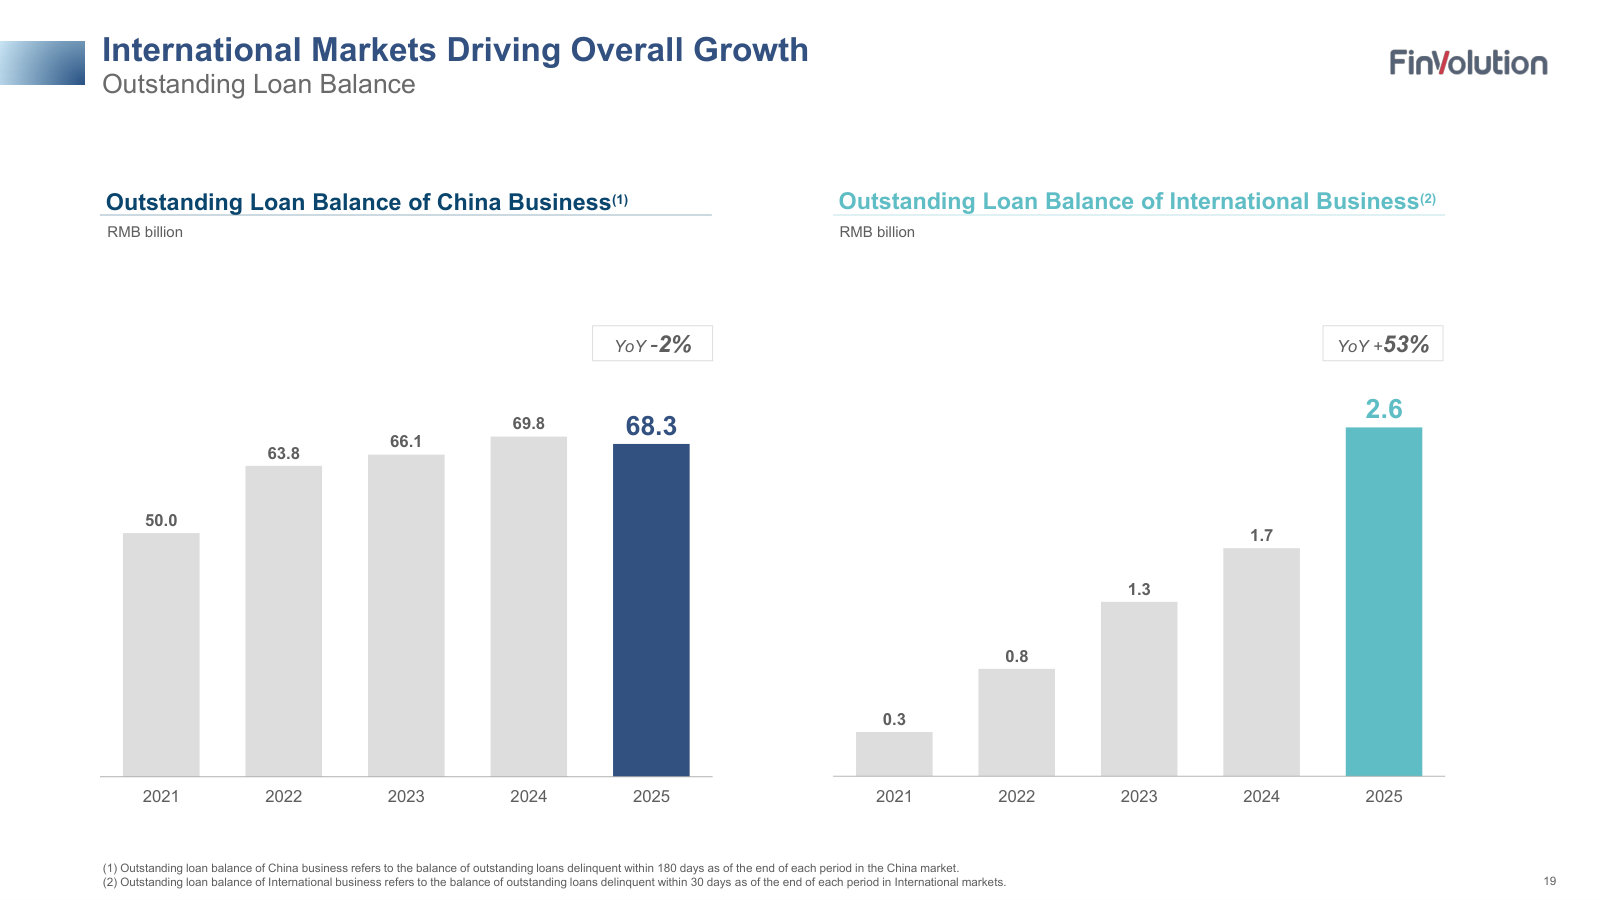
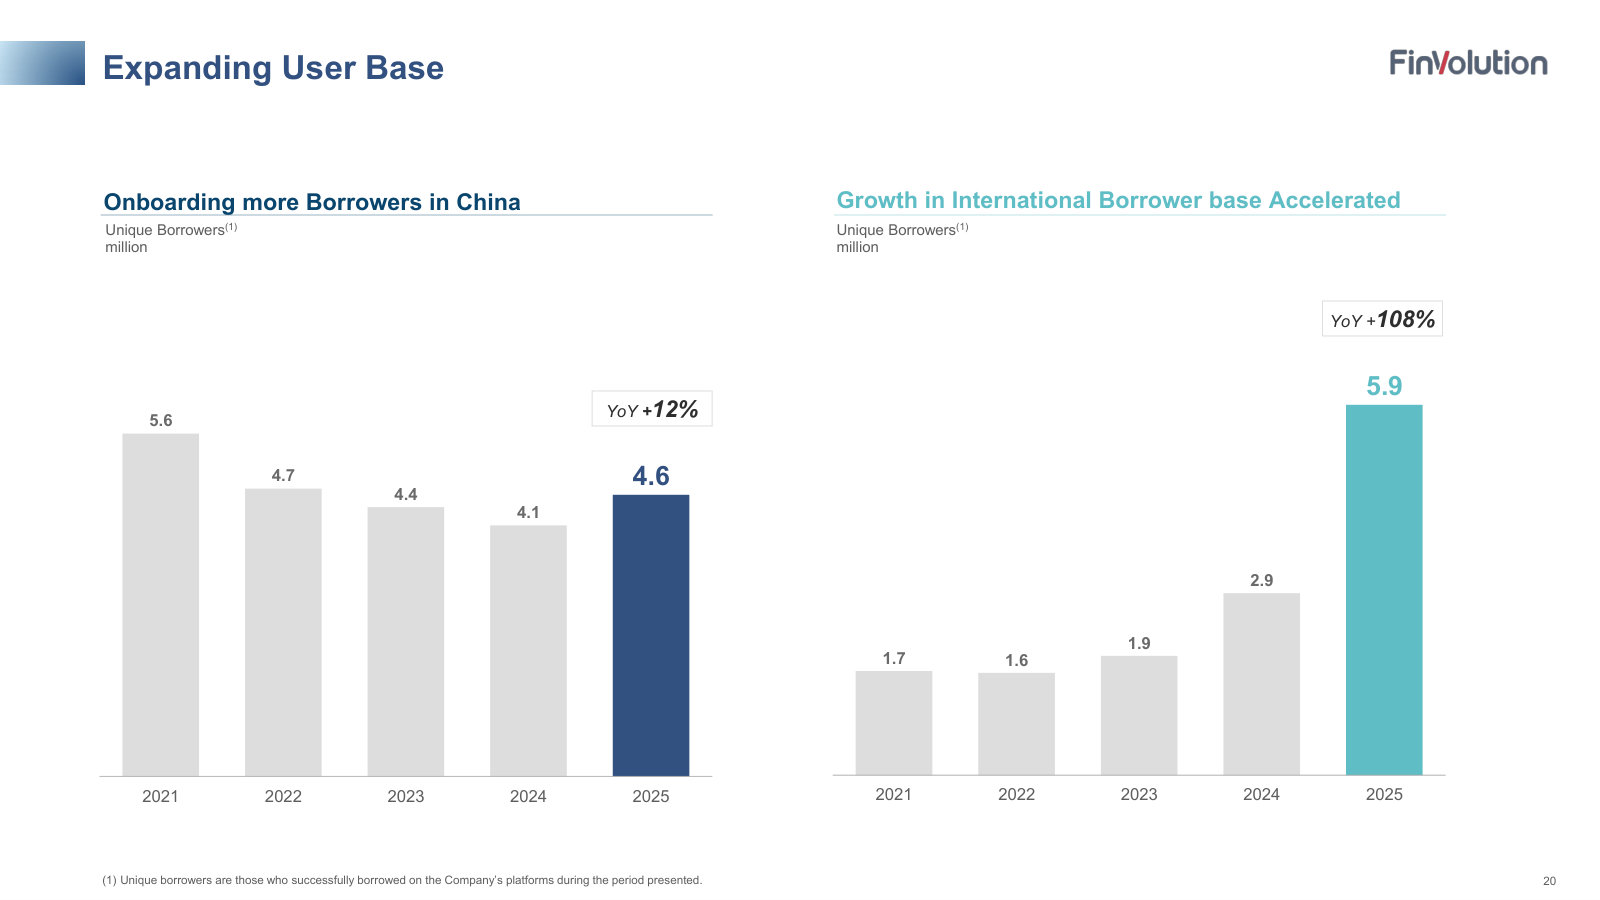
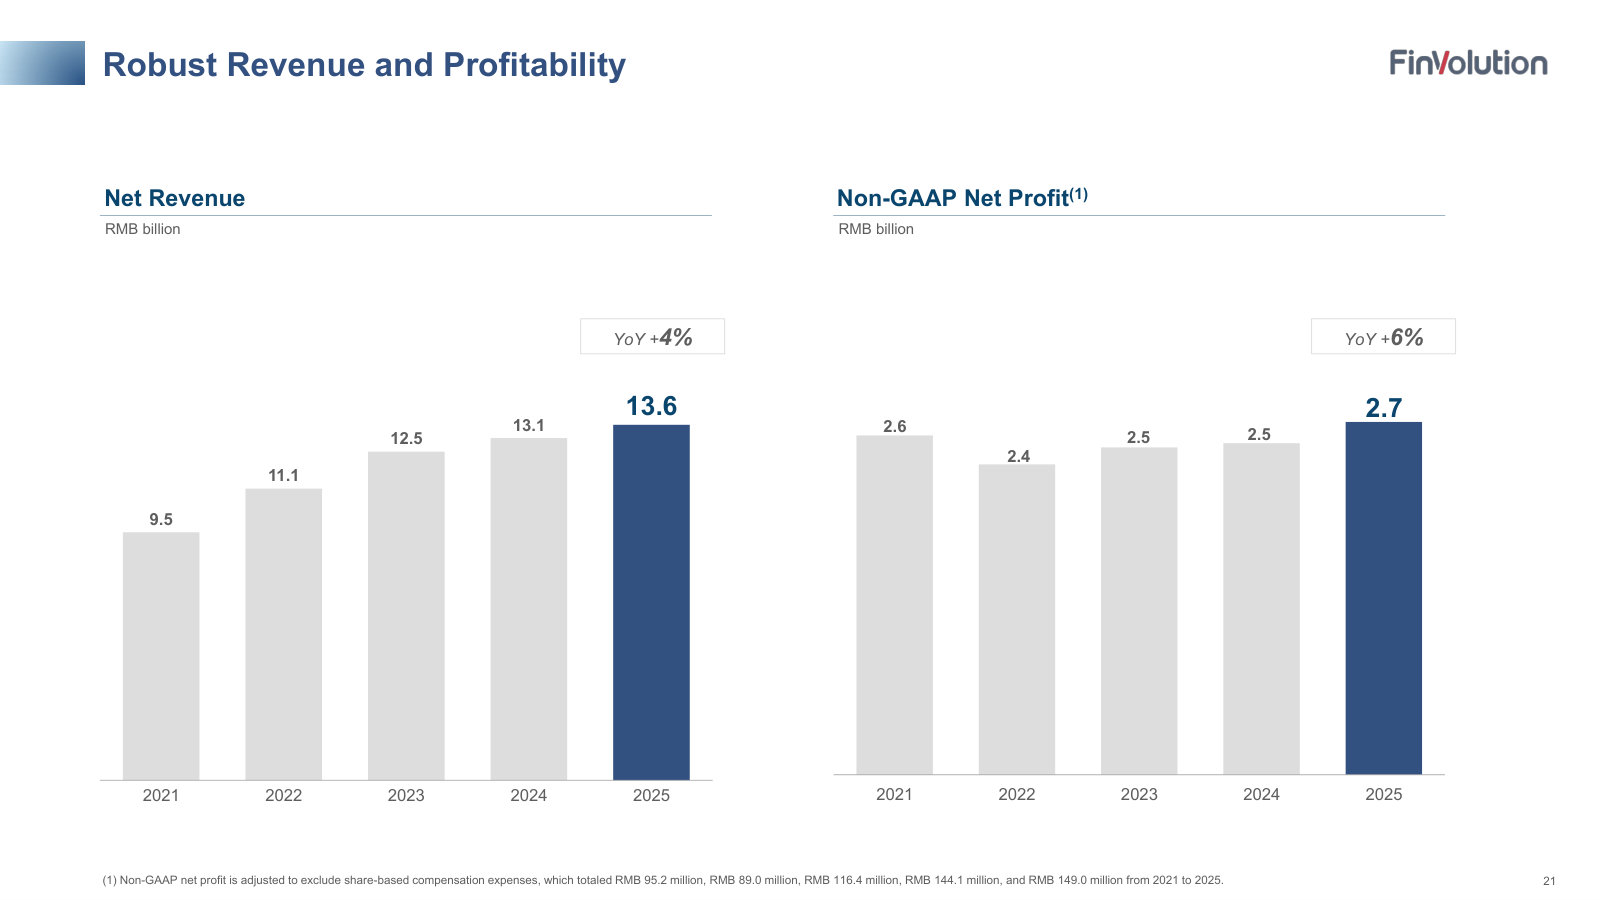
p. 4 — The franchise in one page: China (2007), Indonesia (2018) and the Philippines (2020), with 2025 revenue, transaction volume and loan-balance trends. · Open the full presentation →p. 5 — The strategy arc — China as the profit baseline, Southeast Asia the near-term driver, Australia/Pakistan the next optionality, plotted from 2007 to 2025. · Open the full presentation →p. 6 — The growth matrix: expanding products, upgrading customers from near-prime to prime, and multiplying across countries. · Open the full presentation →p. 7 — 'LEGO+' strategy: how China's market evolved from volume-based to LTV-based, and why that experience maps onto developed markets. · Open the full presentation →p. 8 — Why developed markets are hard to enter — license, reputation, capital, underwriting — and how FinVolution claims to clear each barrier. · Open the full presentation →p. 9 — The Fundo acquisition (Oct 2025): an ACL-licensed, near-prime online lender that marks FinVolution's entry into Australia. · Open the full presentation →p. 10 — The operating system: AI-driven data tech at the base, deep know-how in the middle, 18 years of cross-cycle expertise on top — the engine it aims to replicate market to market. · Open the full presentation →p. 11 — How borrowers are acquired and underwritten: traffic and search channels, federated-learning models, 99% loan automation, and the average loan size and tenure. · Open the full presentation →p. 12 — The lender's core metric — day-1 delinquency and 30-day collection through cycles, plus M1+ delinquency by vintage. · Open the full presentation →p. 13 — Capital returns: eight straight years of dividends plus buybacks, and a payout ratio climbing toward 50% of net profit. · Open the full presentation →p. 16 — The 2025 scorecard: user base, transaction momentum and financial return, each with year-on-year change. · Open the full presentation →p. 17 — The central thesis — international markets lifting revenue mix from 9% to 25% while China stays roughly flat. · Open the full presentation →p. 18 — Transaction volume split China (-5%) vs international (+39%) — the geographic pivot in the top-line flow. · Open the full presentation →p. 19 — Outstanding loan balance split China (-2%) vs international (+53%) — the same pivot on the balance sheet. · Open the full presentation →p. 20 — Unique borrowers split China (+12%) vs international (+108%) — where new users are actually coming from. · Open the full presentation →p. 21 — Five-year net revenue and non-GAAP net profit — steady growth against a China regulatory transition. · Open the full presentation →
Featured for four explanatory slides the newest deck dropped — how the loan-facilitation model actually works, the market-penetration case, and the addressable market. · Open the full document →
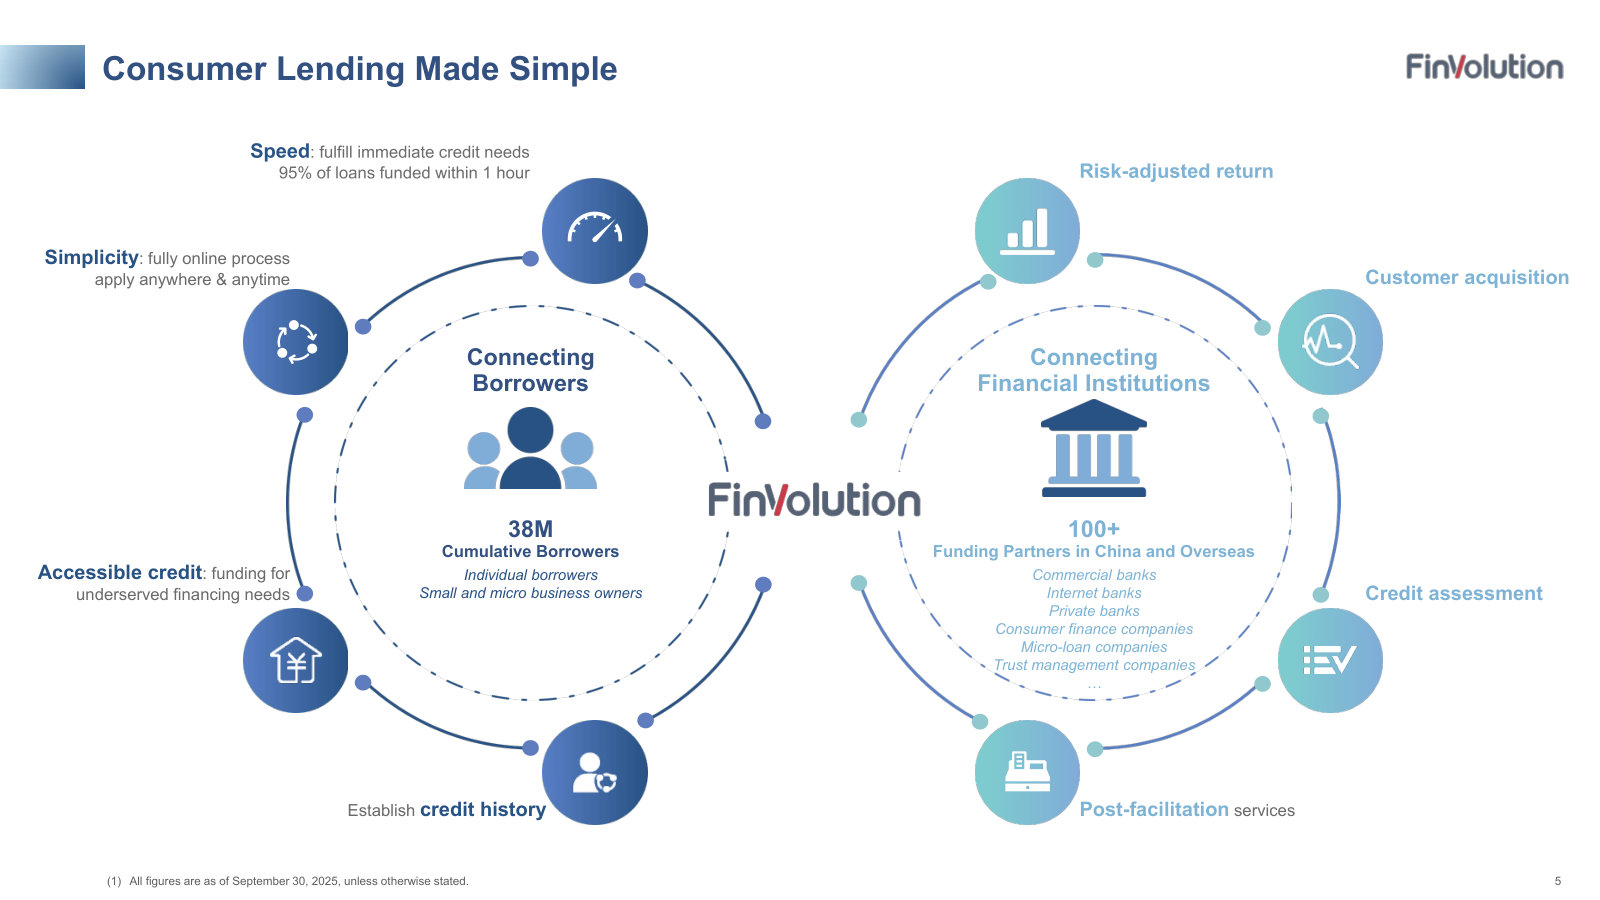
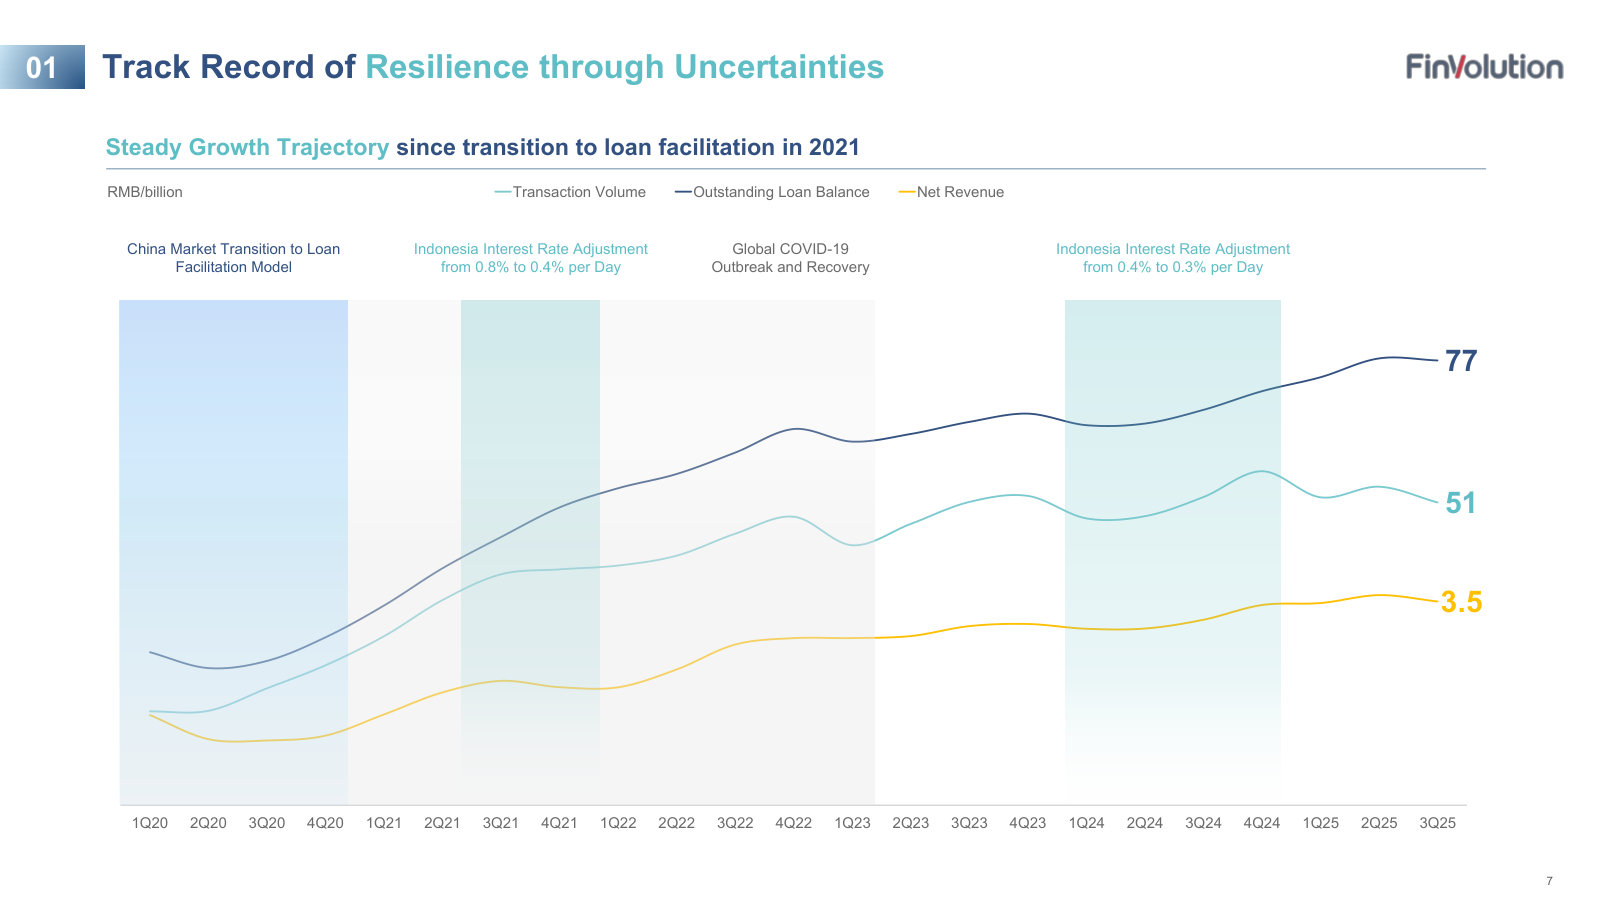
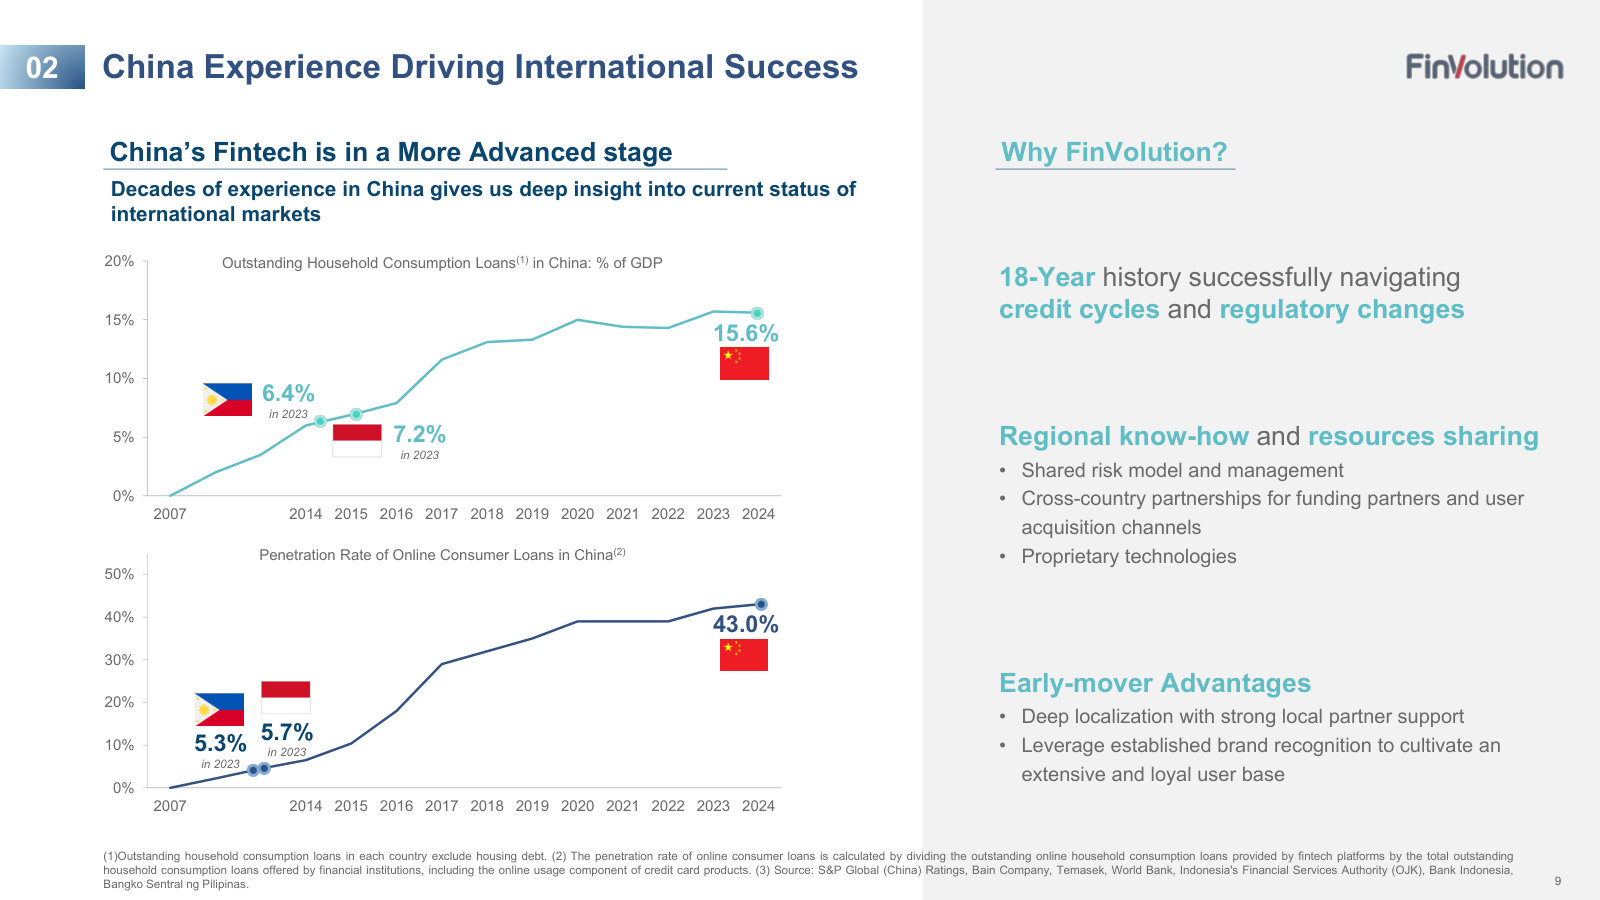
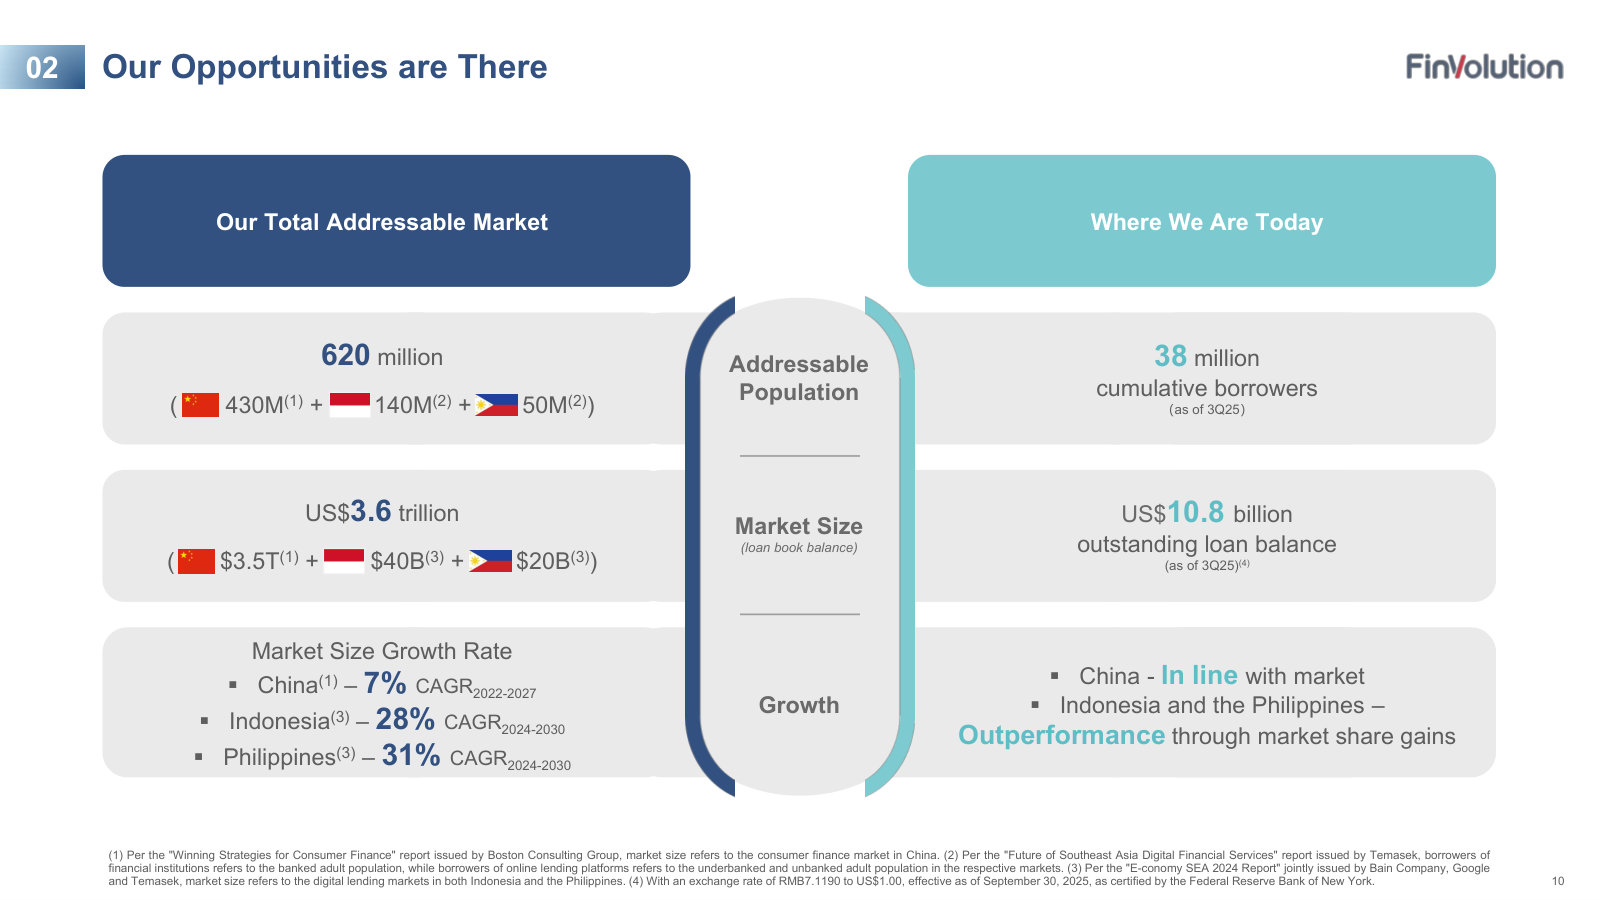
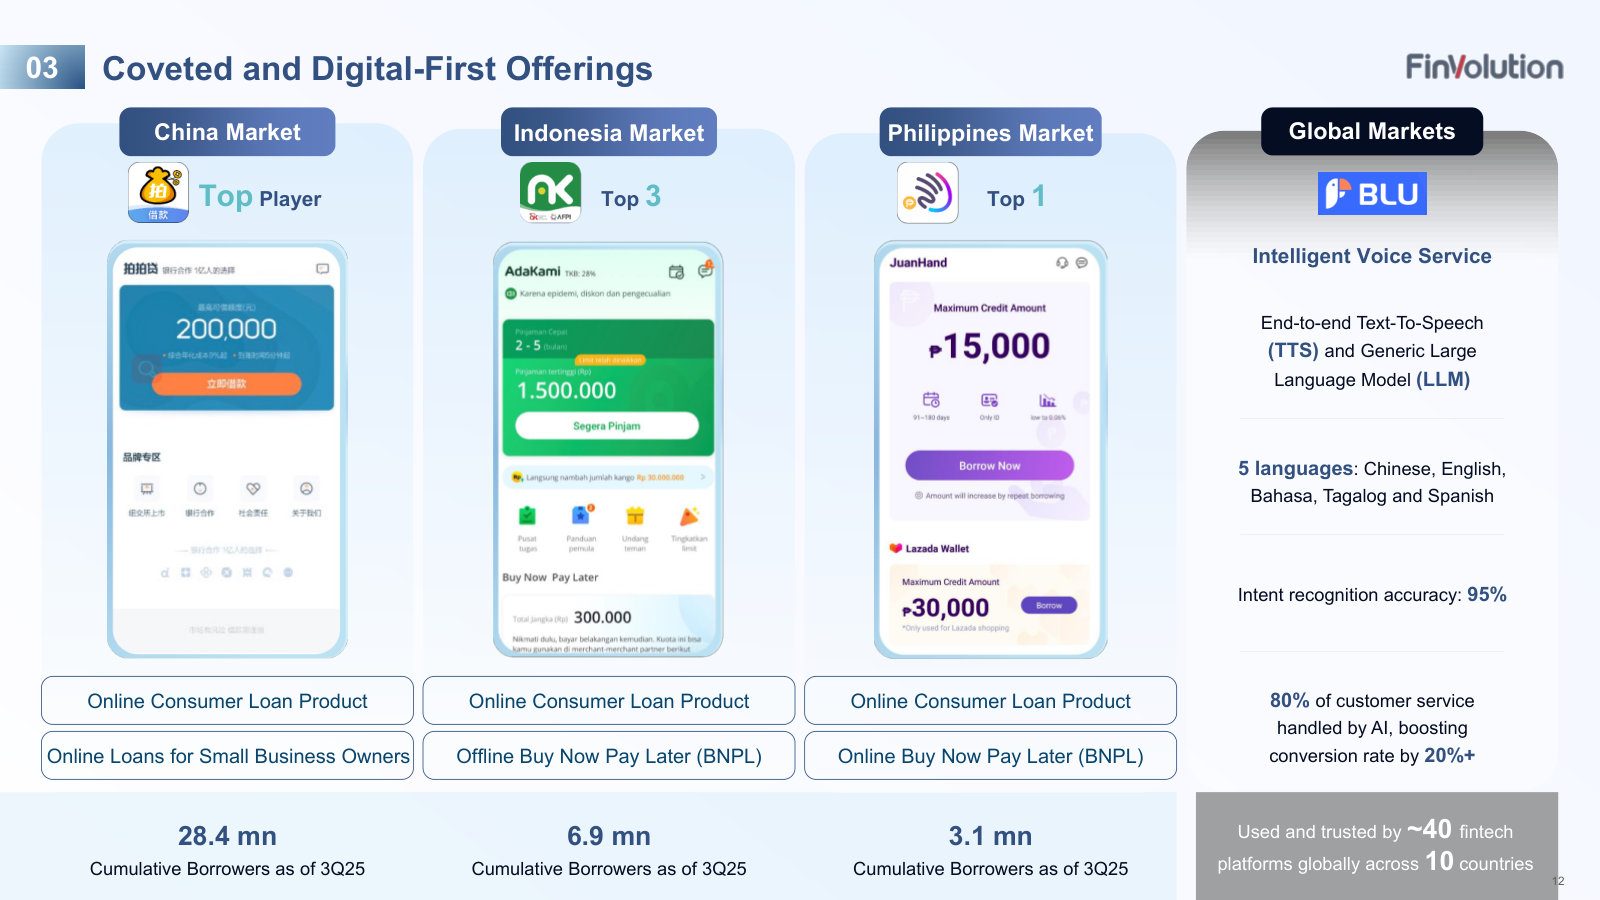
p. 5 — How the business works and makes money: a two-sided platform connecting 38M borrowers to 100+ banks and finance companies, earning fees for facilitation, not lending its own balance sheet. · Open the full presentation →p. 7 — Cross-cycle track record — transaction volume, loan balance and revenue since the 2021 shift to loan facilitation, annotated with COVID and Indonesia rate changes. · Open the full presentation →p. 9 — The international case: China's household-credit and online-lending penetration far exceeds Indonesia's and the Philippines', framing where those markets are headed. · Open the full presentation →p. 10 — The addressable market — 620M people and a US$3.6T loan market across three countries against 38M borrowers and US$10.8B of balances today. · Open the full presentation →p. 12 — Product by market: the flagship lending apps in China, Indonesia and the Philippines, plus the BLU AI voice service sold to ~40 fintechs. · Open the full presentation →
Investor Presentation — Q2 2025 — Q2 2025 · 27 pages · The mid-2025 interim data point, for readers tracking the quarter-by-quarter progression before the Q3 and full-year decks. · Open →
Investor Presentation — Q4 2024 / Full-Year 2024 — Q4 & FY2024 · 24 pages · The prior full-year review, with an explicit revenue-model slide (fees from funding partners) and leverage/liquidity detail the 2025 decks trimmed. · Open →
Investor Presentation — Q4 2022 / Full-Year 2022 — Q4 & FY2022 · 24 pages · The earliest deck on file, carrying a per-RMB100 unit-economics slide and balance-sheet detail that later editions dropped. · Open →