Full Report
The numbers behind FinVolution Group: as-reported financial statements and company metrics for FY2021–FY2025, traced to the source filings, opened with the share-price history those statements have to justify. Every linked figure opens the exact page of the filing it was printed on, with the statement row highlighted. Amounts in RMB thousands unless noted.
Reading notes: All figures are in thousands of Renminbi (RMB) exactly as printed on the face of FinVolution's SEC filings (Form 20-F annual reports and quarterly earnings releases), which report in RMB with a supplemental US$ convenience-translation column that is not used here. The company is a Cayman-incorporated foreign private issuer filing under U.S. GAAP; its ADSs trade on the NYSE (one ADS = five Class A ordinary shares). Each of FY2021-FY2025 is cited to that fiscal year's own Form 20-F (current-year column). FY2019 and FY2020 figures in the Long-Term Record are the comparative columns of the FY2021 Form 20-F. Revenue is shown two ways: by product/service line (loan facilitation fees, post-facilitation fees, guarantee income, net interest income, other) from the face of the income statement, and by geography (the PRC, Indonesia, Philippines, others) from the Geographic information note. The Philippines was disclosed separately only from FY2023; in FY2021-FY2022 it is included within 'Others'. The FY2021 balance-sheet line 'Liability from quality assurance commitment' was captioned 'Expected credit losses for quality assurance commitment' in the FY2021 Form 20-F; the label was standardized here.
Share Price — Full Available History — 9 Years
The stock closed at $4.78 on Jul 16, 2026 — down 63% over the window shown (-10.9% a year), trading between $1.30 and $13.15.
Source: market price feed, weekly closes, sampled from 2,180 source observations, Nov 2017–Jul 2026. Price return only, excludes dividends.
FY2025 at a Glance
Revenue (RMB thousands)
Diluted EPS
Source: FY2025 consolidated statements [1] [2] [3] [4]. Click any linked figure to open the filing page with the row highlighted.
Net Revenue by Product
| Net Revenue by Product | FY2021 | FY2022 | FY2023 | FY2024 | FY2025 |
|---|---|---|---|---|---|
| Loan facilitation service fees | 3,794,182 | 4,430,778 | 4,520,504 | 4,694,380 | 5,176,457 |
| Post-facilitation service fees | 1,309,565 | 1,929,913 | 1,969,705 | 1,740,241 | 1,629,777 |
| Guarantee income | 2,593,512 | 3,064,440 | 4,478,995 | 5,085,296 | 4,124,934 |
| Net interest income | 1,216,170 | 1,174,204 | 1,049,379 | 853,779 | 1,336,459 |
| Other revenue | 556,699 | 534,868 | 528,862 | 692,128 | 1,301,856 |
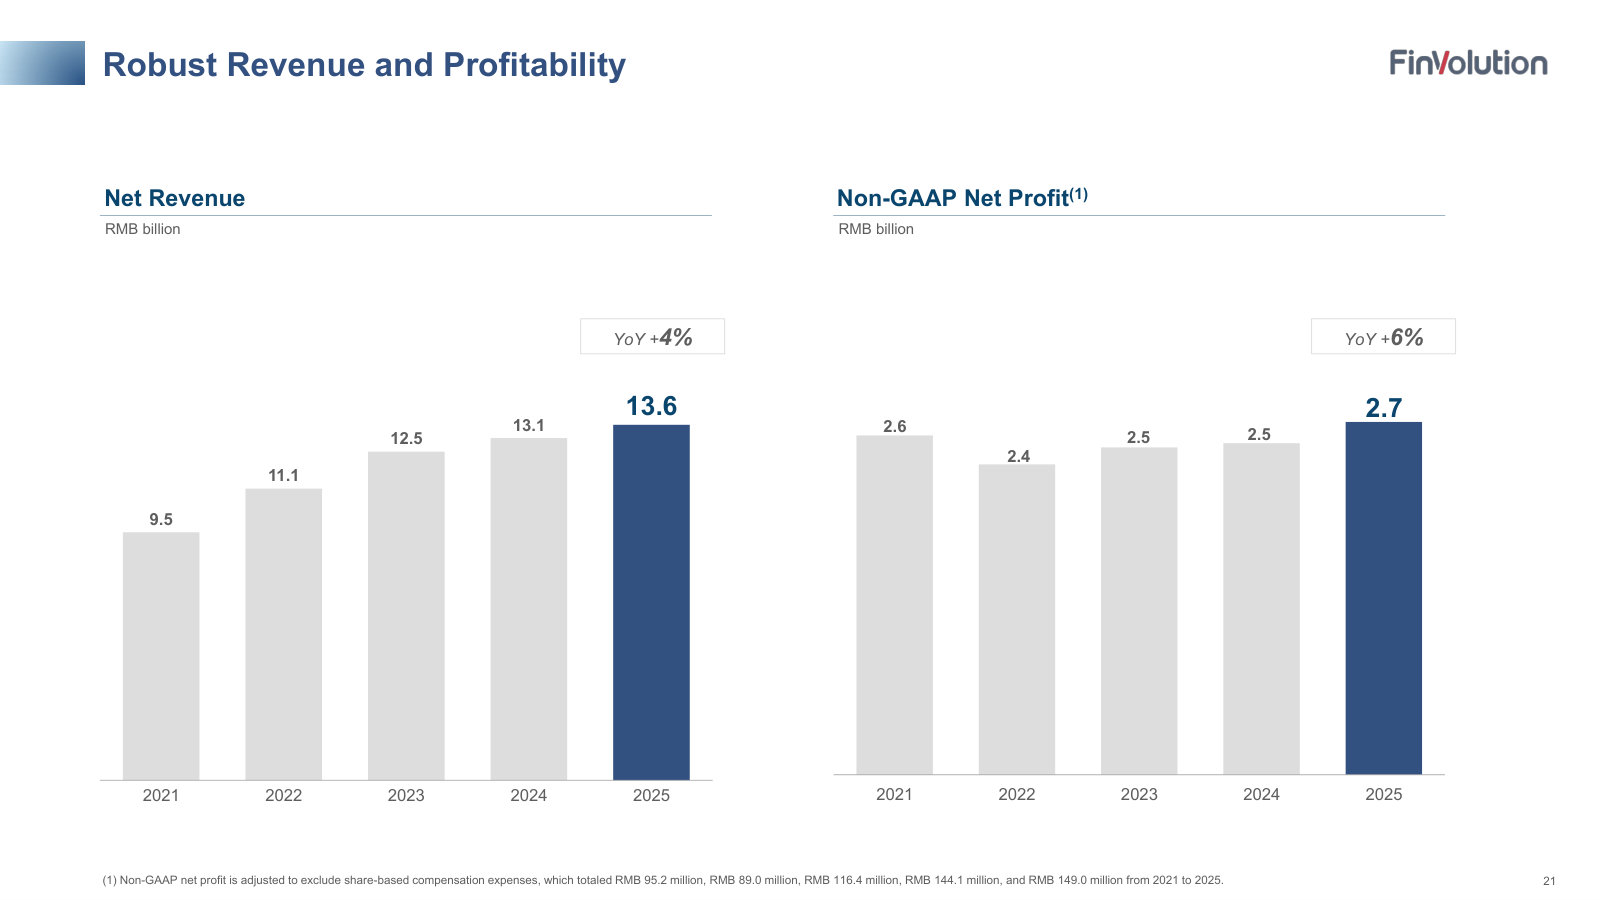
| Net revenues | 9,470,128 | 11,134,203 | 12,547,445 | 13,065,824 | 13,569,483 |
| Net revenues growth, derived | — | +17.6% | +12.7% | +4.1% | +3.9% |
Source: Consolidated Statements of Comprehensive Income - operating revenue lines [1] [2] [4] [5]. Click any linked figure to open the filing page with the row highlighted.
Income Statement
Source: Consolidated Statements of Comprehensive Income [1] [2] [3] [4]. Click any linked figure to open the filing page with the row highlighted.
Columns marked E are consensus analyst estimates shown alongside reported results for direct comparison; they are not company guidance.
Estimate source: Yahoo Finance analyst consensus, as of 2026-07-16. Estimate figures link to the consensus source, not to filing pages.
Balance Sheet
Source: Consolidated Balance Sheets [6] [7] [8] [9]. Click any linked figure to open the filing page with the row highlighted.
Cash Flow
Source: Consolidated Statements of Cash Flows [10] [11] [12] [13]. Click any linked figure to open the filing page with the row highlighted.
Net Revenue by Geography
| Net Revenue by Geography | FY2021 | FY2022 | FY2023 | FY2024 | FY2025 |
|---|---|---|---|---|---|
| The PRC | 8,643,683 | 9,984,500 | 10,410,574 | 10,533,327 | 10,238,018 |
| Indonesia | 701,642 | 1,067,429 | 1,885,586 | 1,887,770 | 2,039,063 |
| Philippines | — | — | 251,719 | 639,510 | 1,192,287 |
| Others | 124,803 | 82,274 | (434) | 5,217 | 100,115 |
| Total revenue | 9,470,128 | 11,134,203 | 12,547,445 | 13,065,824 | 13,569,483 |
Source: Form 20-F financial statement notes - Geographic information [14] [15]. Click any linked figure to open the filing page with the row highlighted.
Platform Loan Volume (RMB)
| Platform Loan Volume (RMB) | FY2021 | FY2022 | FY2023 | FY2024 | FY2025 |
|---|---|---|---|---|---|
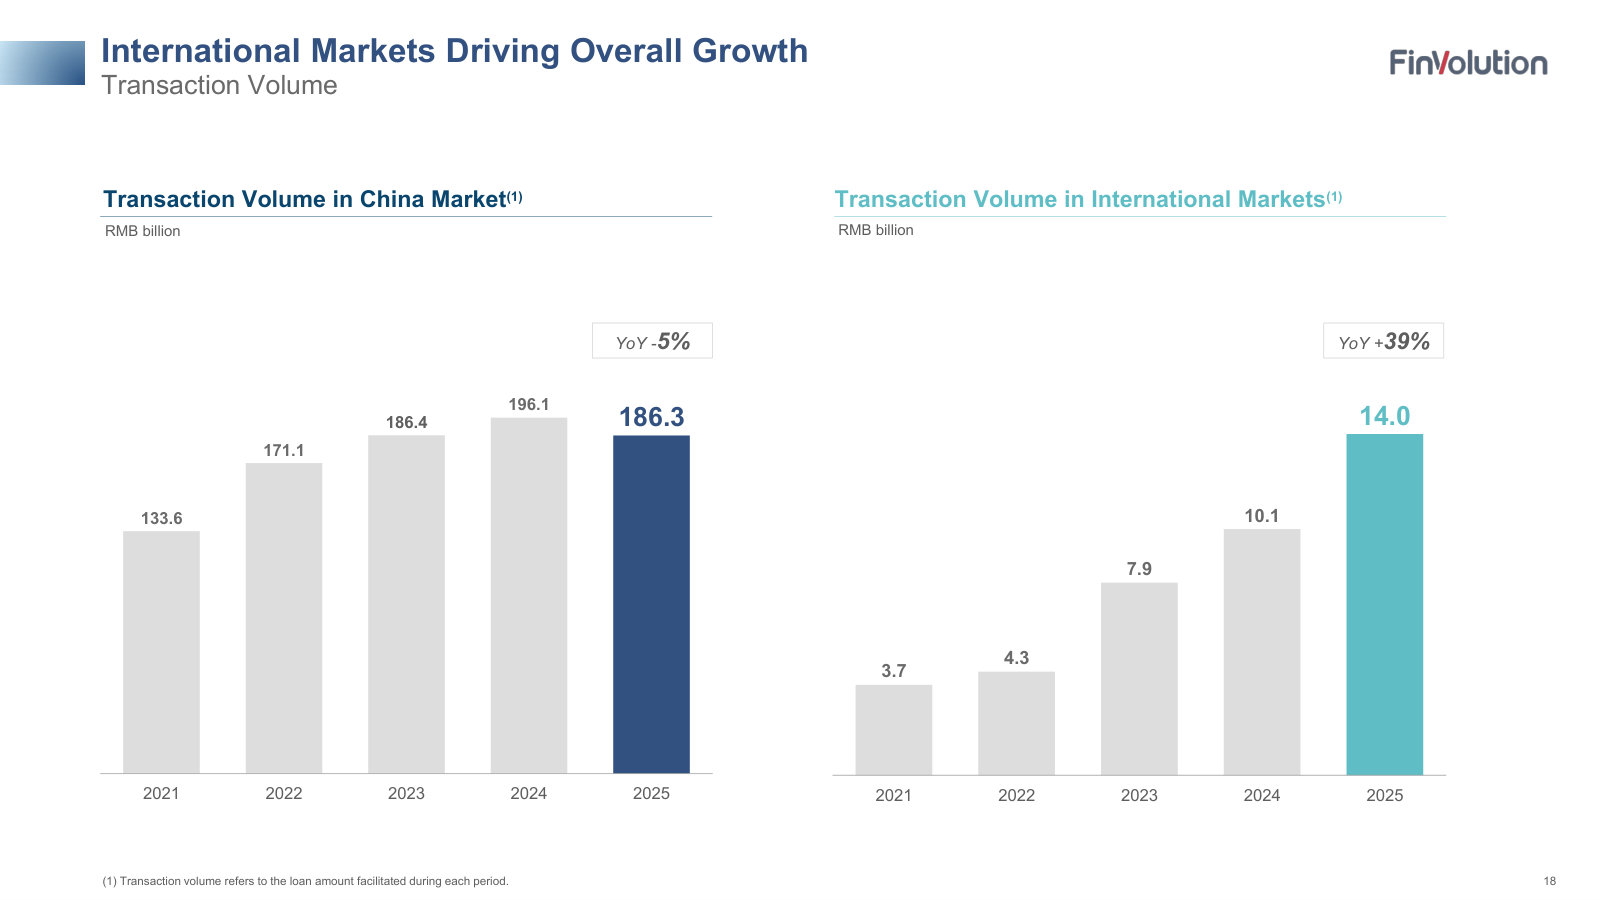
| Loan origination volume - total | 137,400,000 | 175,400,000 | 194,300,000 | 206,200,000 | 200,300,000 |
| Loan origination volume - China | 133,600,000 | 171,100,000 | 186,400,000 | 196,100,000 | 186,300,000 |
| Loan origination volume - international | 3,700,000 | 4,300,000 | 7,900,000 | 10,100,000 | 14,000,000 |
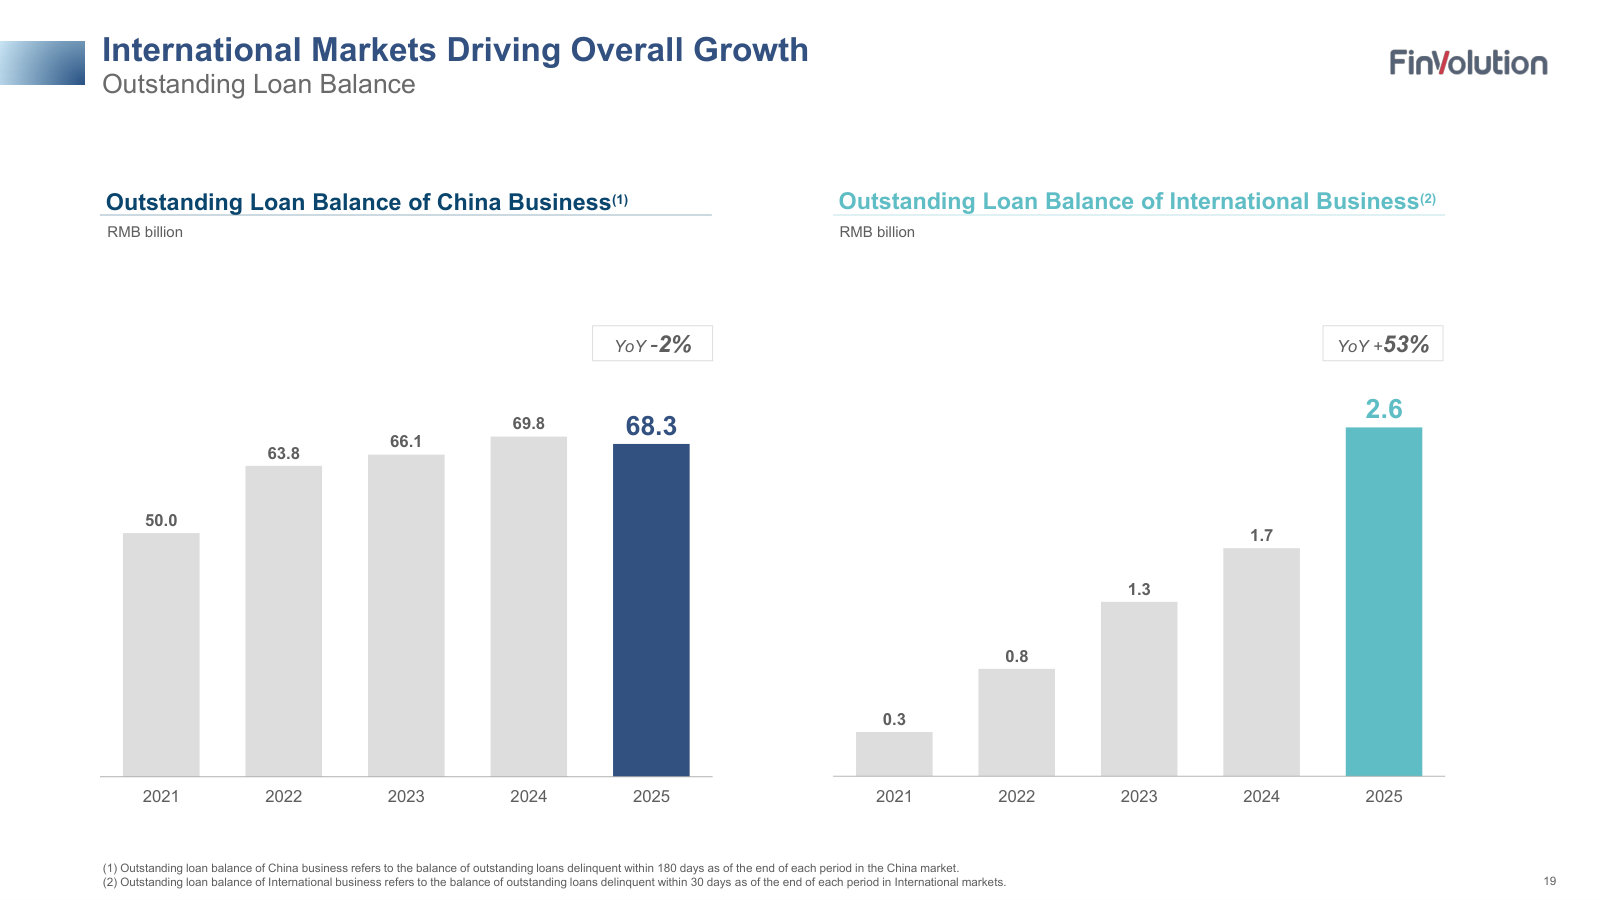
| Outstanding loan balance - China | 50,000,000 | 63,800,000 | 66,100,000 | 69,800,000 | 68,300,000 |
| Outstanding loan balance - international | 330,000 | 800,400 | 1,262,300 | 1,696,200 | 2,570,100 |
Source: company filings [16] [17] [18] [19]. Click any linked figure to open the filing page with the row highlighted.
Registered Users Active Borrowers
| Registered Users Active Borrowers | FY2021 | FY2022 | FY2023 | FY2024 | FY2025 |
|---|---|---|---|---|---|
| Cumulative registered users - China | 131,200,000 | 143,900,000 | 155,600,000 | 172,600,000 | 187,400,000 |
| Cumulative registered users - international | 9,100,000 | 15,500,000 | 24,600,000 | 35,700,000 | 52,100,000 |
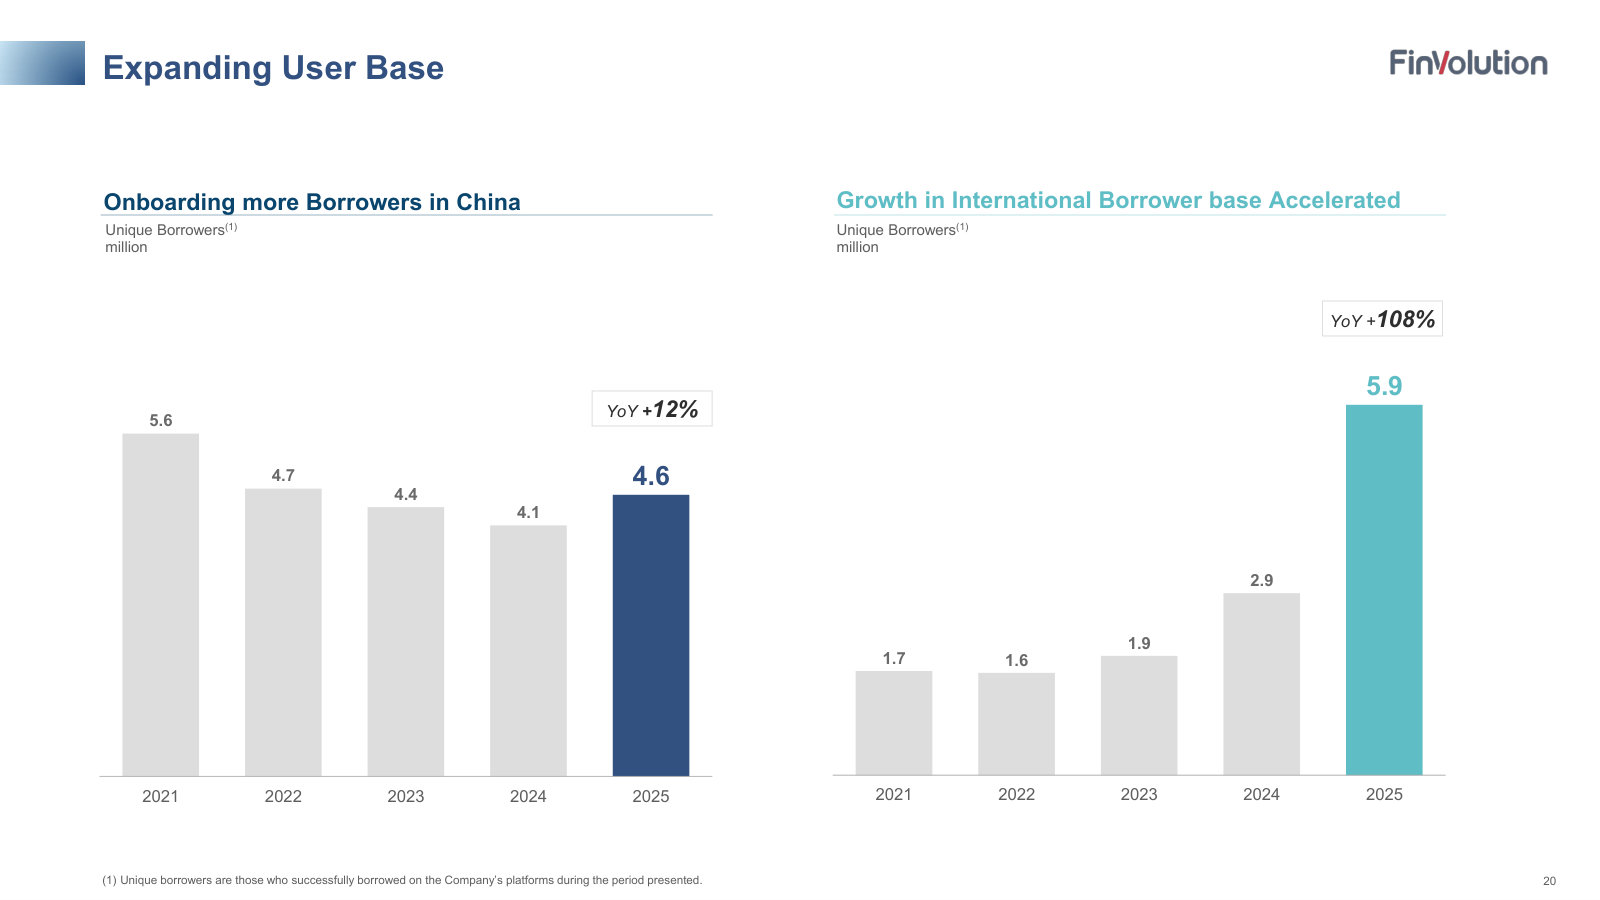
| Unique borrowers funded in year - China | 5,600,000 | 4,700,000 | 4,400,000 | 4,100,000 | 4,600,000 |
| Unique borrowers funded in year - international | 1,700,000 | 1,600,000 | 1,900,000 | 2,900,000 | 5,900,000 |
Source: company filings [20] [16] [18]. Click any linked figure to open the filing page with the row highlighted.
Borrower Loan Economics
| Borrower Loan Economics | FY2021 | FY2022 | FY2023 | FY2024 | FY2025 |
|---|---|---|---|---|---|
| Average loan amount - China (RMB per loan) | 4,982 | 7,249 | 8,318 | 10,402 | 10,914 |
| Average loan tenor - China (months) | 8.4 | 8.7 | 8.3 | 8.0 | 8.3 |
| Repeat-borrower share of loan volume - China | 80.0% | 86.8% | 87.2% | 86.5% | 84.9% |
| Repeat-borrower share of loan volume - international | 81.5% | 78.1% | 83.5% | 86.2% | 87.6% |
Source: company filings [21] [20] [18] [22]. Click any linked figure to open the filing page with the row highlighted.
Asset Quality Acquisition Efficiency
| Asset Quality Acquisition Efficiency | FY2021 | FY2022 | FY2023 | FY2024 | FY2025 |
|---|---|---|---|---|---|
| 90 Day+ delinquency rate - China | — | — | 2.0% | 2.1% | 2.9% |
| Vintage delinquency rate - China (12-month) | — | — | 2.8% | 2.3% | 1.7% |
| Sales marketing as % of operating revenue | 16.7% | 15.1% | 15.0% | 15.4% | 16.2% |
Source: company filings [23] [24] [21] [25]. Click any linked figure to open the filing page with the row highlighted.
Long-Term Record
| Fiscal year | Total revenue | Net profit attributable to FinVolution Group | Diluted net profit per ADS | Net cash provided by operating activities |
|---|---|---|---|---|
| FY2019 | 5,962,757 | 2,372,850 | 7.64 | (215,522) |
| FY2020 | 7,563,087 | 1,972,700 | 6.61 | 2,206,909 |
| FY2021 | 9,470,128 | 2,508,947 | 8.46 | 630,227 |
| FY2022 | 11,134,203 | 2,266,382 | 7.79 | 268,833 |
| FY2023 | 12,547,445 | 2,340,835 | 8.34 | 1,413,423 |
| FY2024 | 13,065,824 | 2,383,146 | 9.03 | 2,893,160 |
| FY2025 | 13,569,483 | 2,542,405 | 9.59 | 1,867,600 |
Source: consolidated statements across filings; older years from the standardized feed [11] [1] [13] [2]. Click any linked figure to open the filing page with the row highlighted.
Analyst Consensus
Current price
Mean target
Median target
High target
Low target
Estimate source: Yahoo Finance analyst consensus, as of 2026-07-16. Estimate figures link to the consensus source, not to filing pages.
Traceability
442 of 442 figures on this page (100%) link to the filing page where they are printed — click a linked figure to open the source PDF at that page with the row highlighted. Unlinked figures come from standardized data feeds or pre-filing years.
All figures are in thousands of Renminbi (RMB) exactly as printed on the face of FinVolution's SEC filings (Form 20-F annual reports and quarterly earnings releases), which report in RMB with a supplemental US$ convenience-translation column that is not used here. The company is a Cayman-incorporated foreign private issuer filing under U.S. GAAP; its ADSs trade on the NYSE (one ADS = five Class A ordinary shares).
Each of FY2021-FY2025 is cited to that fiscal year's own Form 20-F (current-year column). FY2019 and FY2020 figures in the Long-Term Record are the comparative columns of the FY2021 Form 20-F.
Revenue is shown two ways: by product/service line (loan facilitation fees, post-facilitation fees, guarantee income, net interest income, other) from the face of the income statement, and by geography (the PRC, Indonesia, Philippines, others) from the Geographic information note. The Philippines was disclosed separately only from FY2023; in FY2021-FY2022 it is included within 'Others'.
The FY2021 balance-sheet line 'Liability from quality assurance commitment' was captioned 'Expected credit losses for quality assurance commitment' in the FY2021 Form 20-F; the label was standardized here.
The unaudited quarterly block (Q1 FY2025-Q1 FY2026) is taken from FinVolution's quarterly earnings-release financial statements; single-quarter income, point-in-time balance sheet, and single-quarter cash-flow figures are each cited directly to the release that printed them.
4 figure(s) differed between the data feed and the filing; the filing value is shown (see the run's metrics/metrics_tab.json for the audit trail).
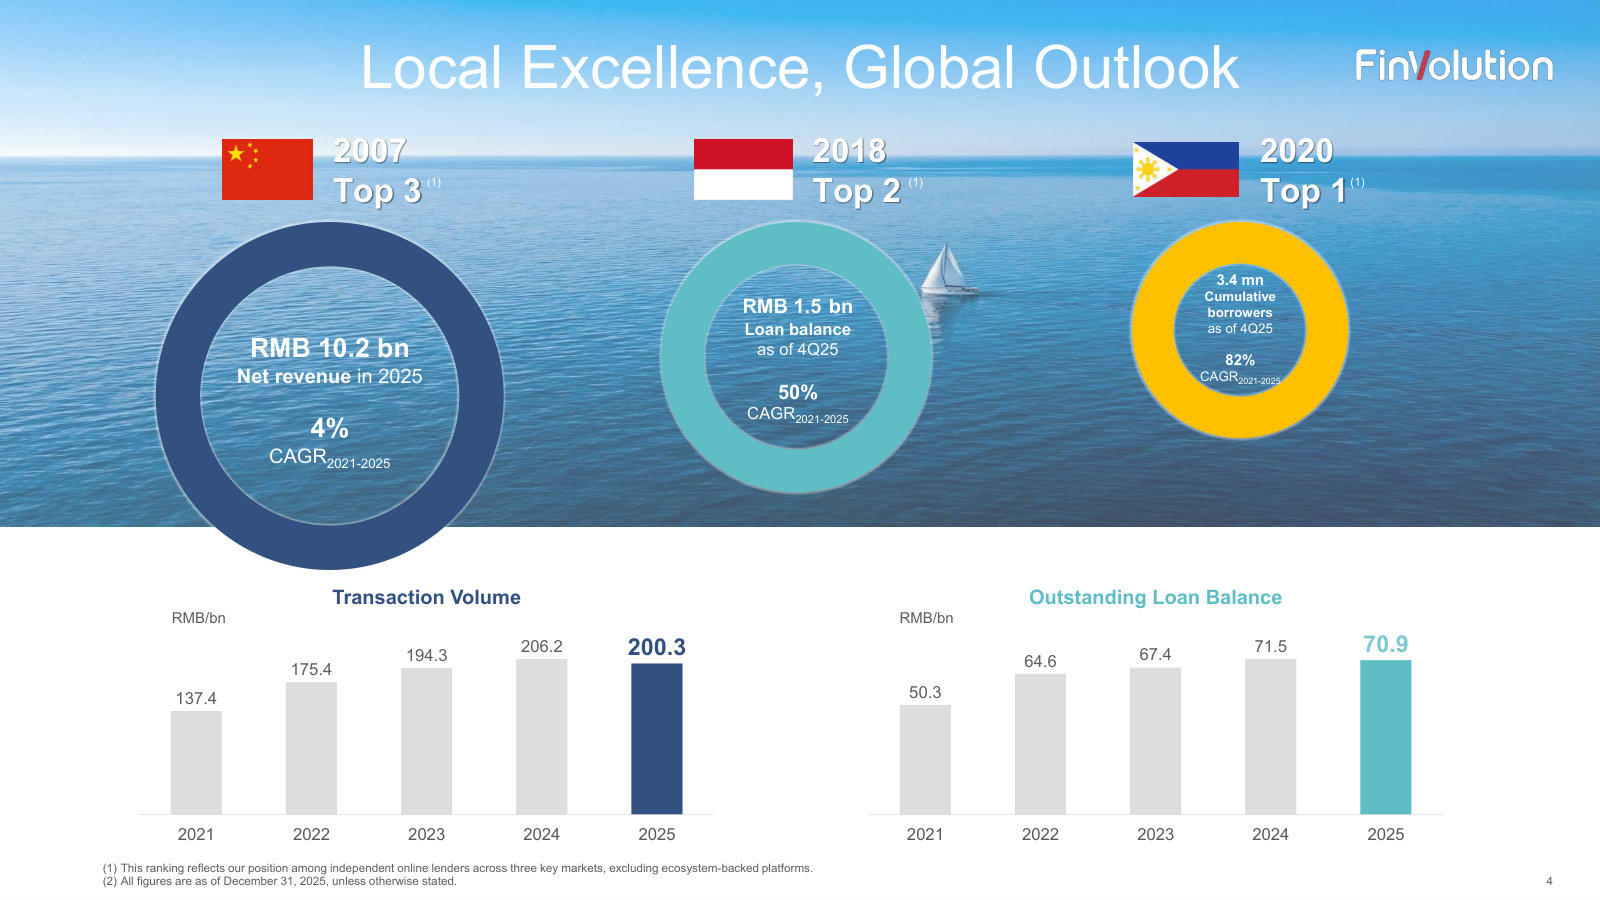
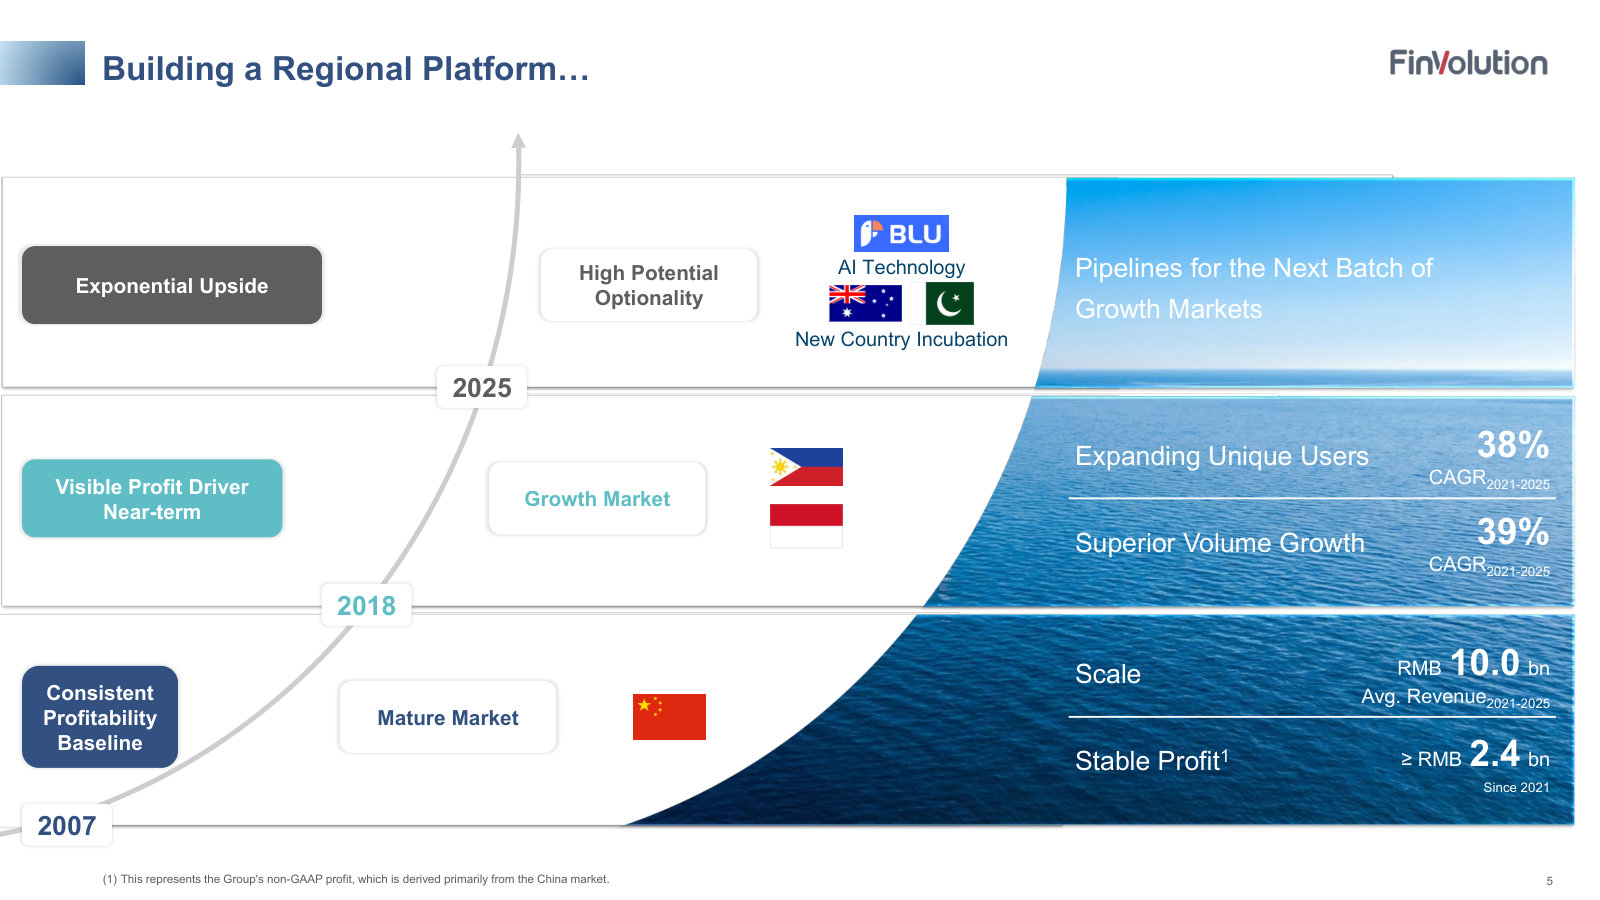
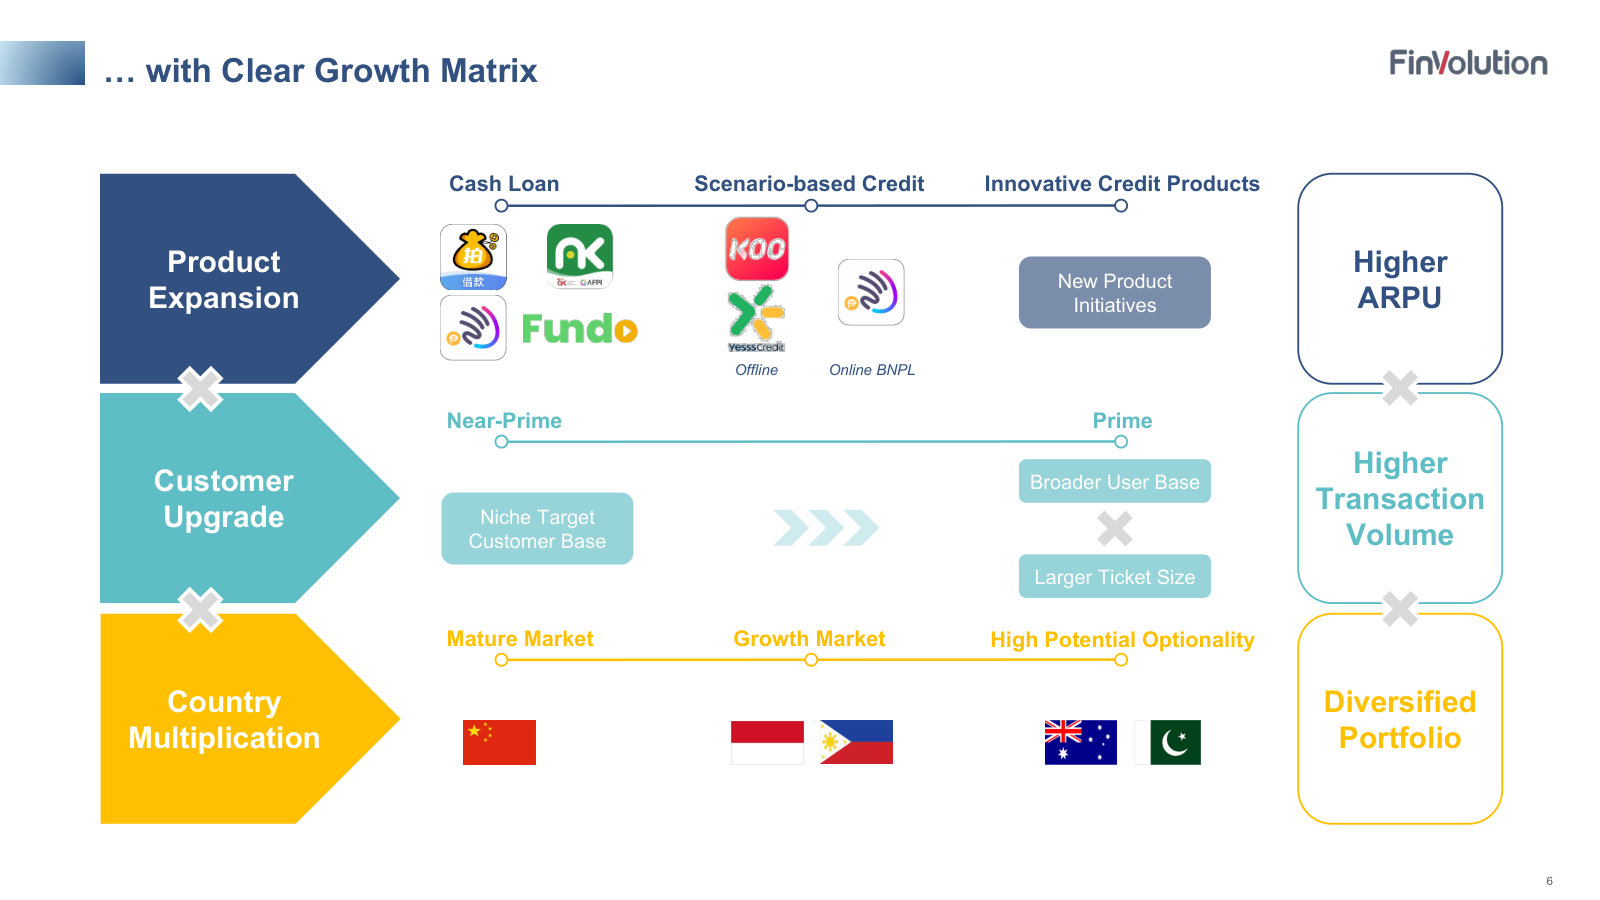
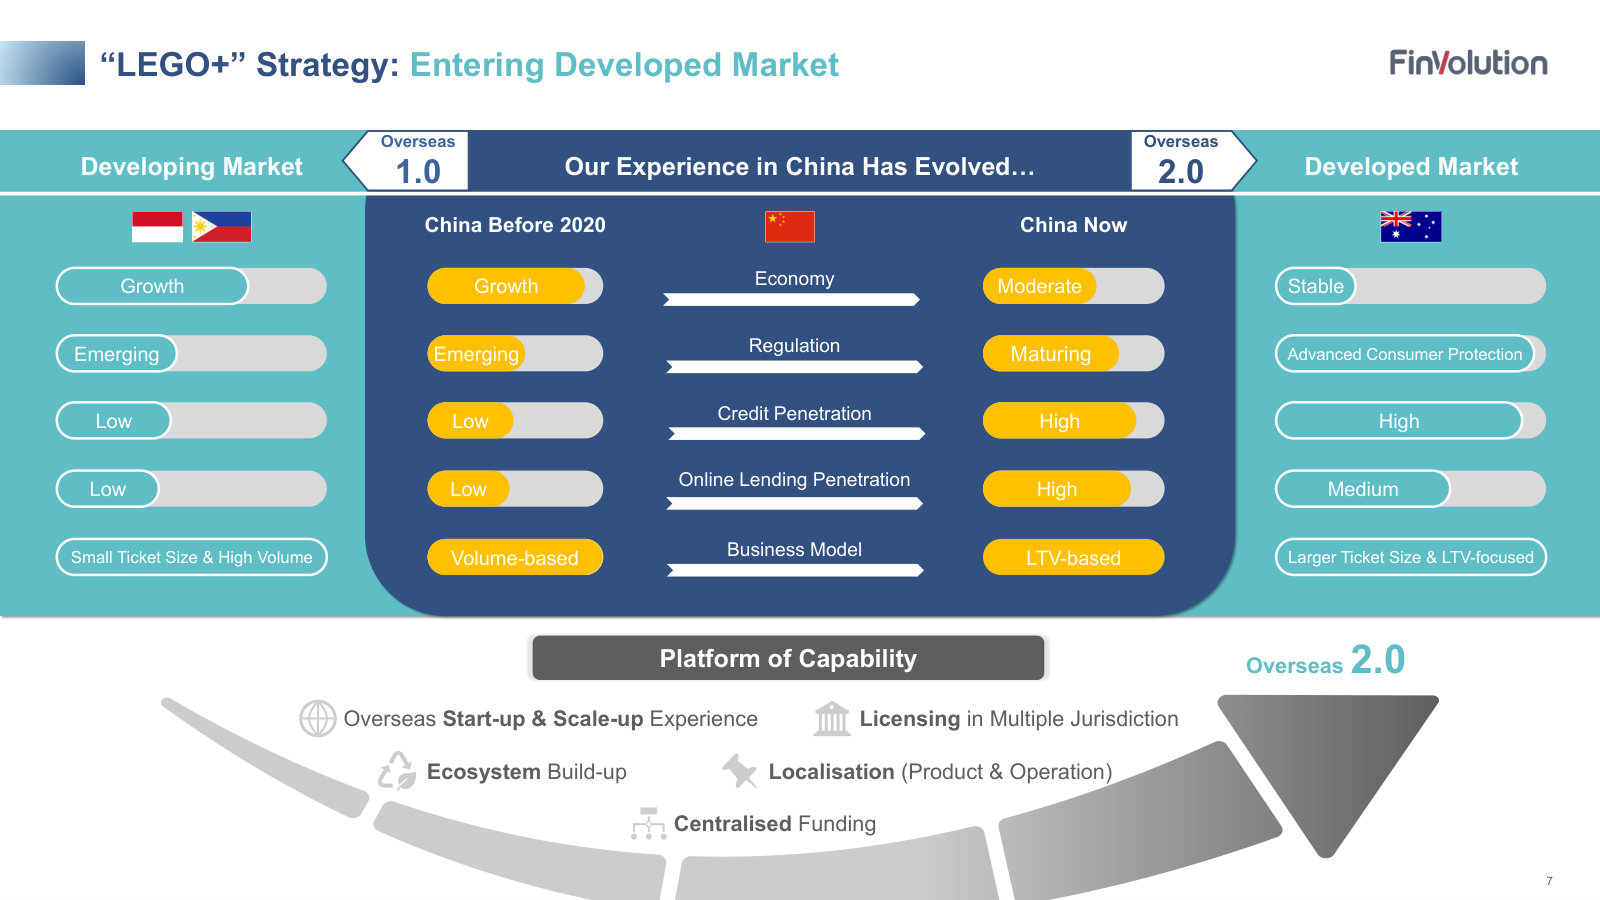
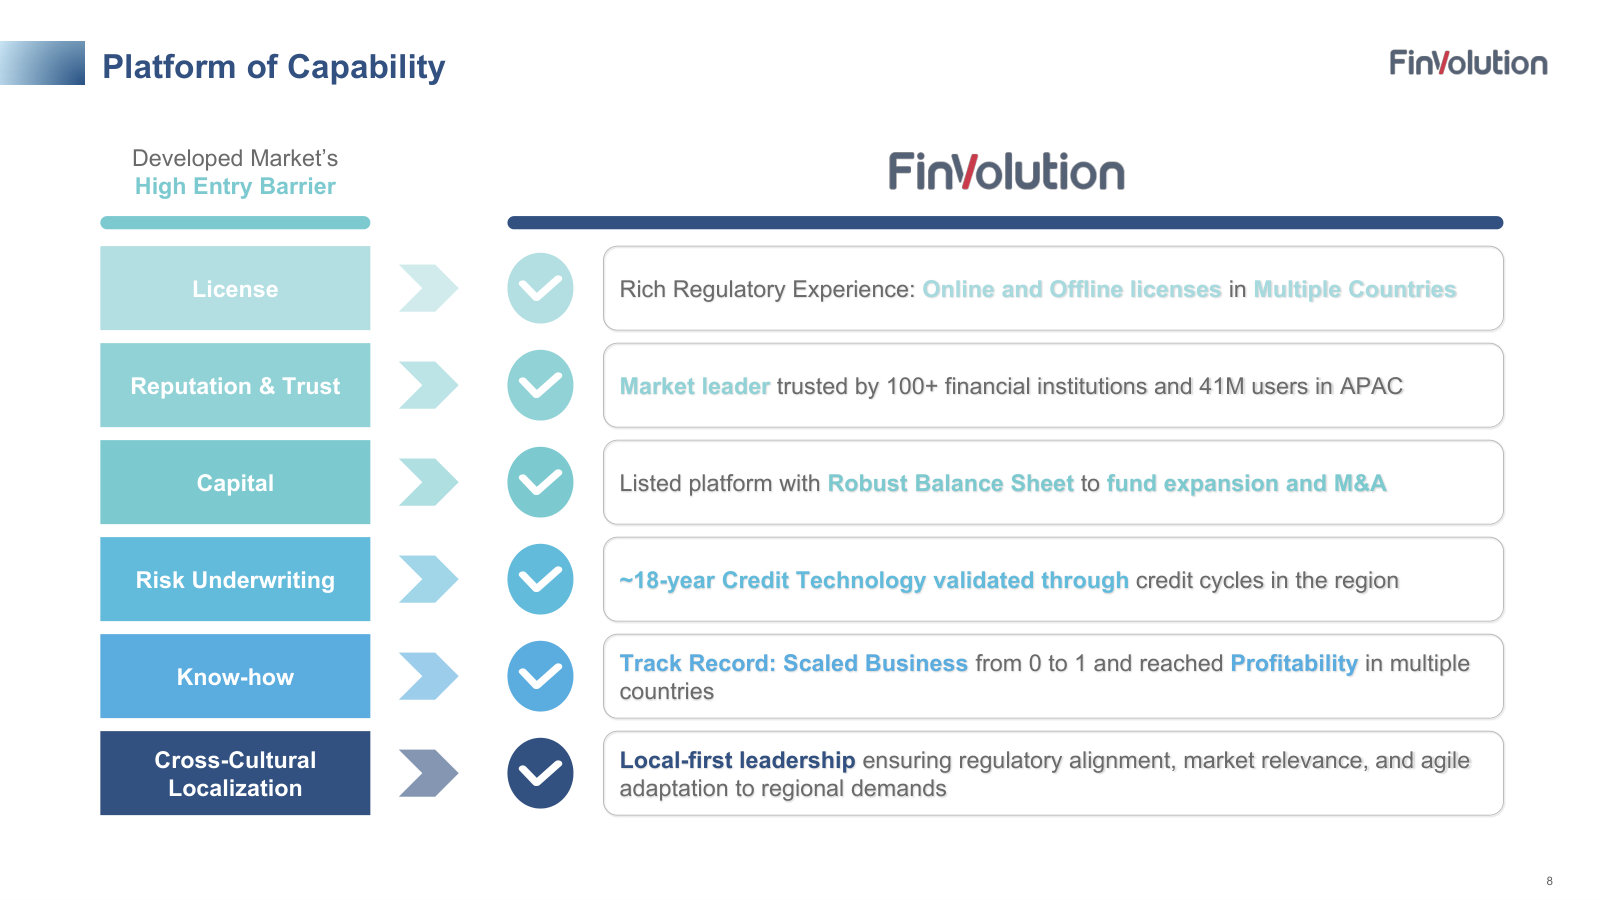
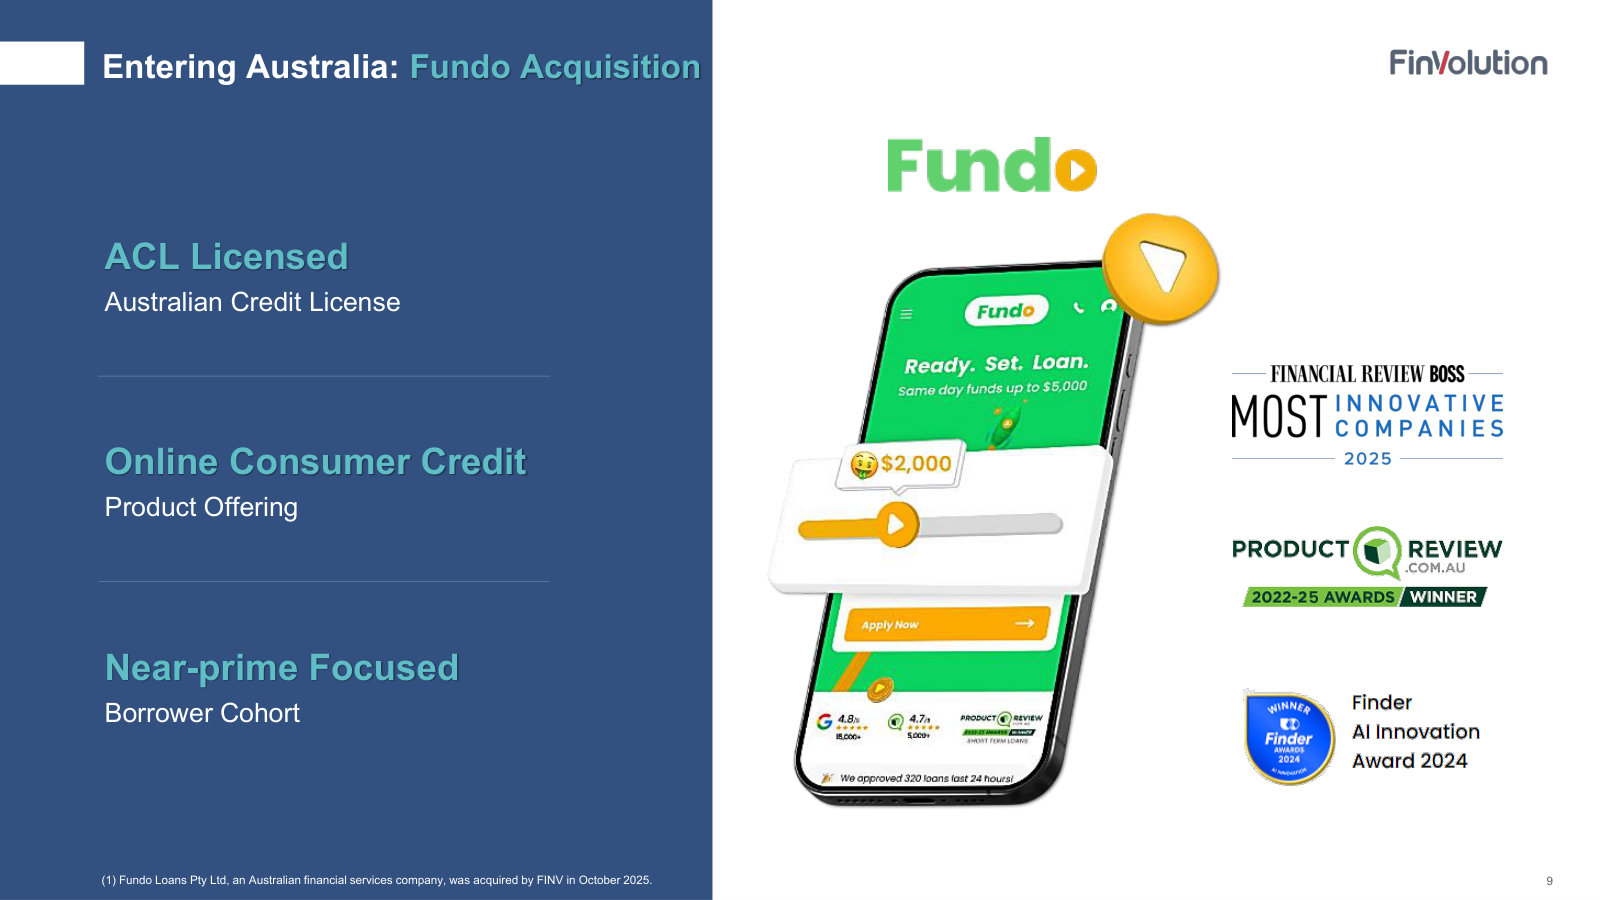
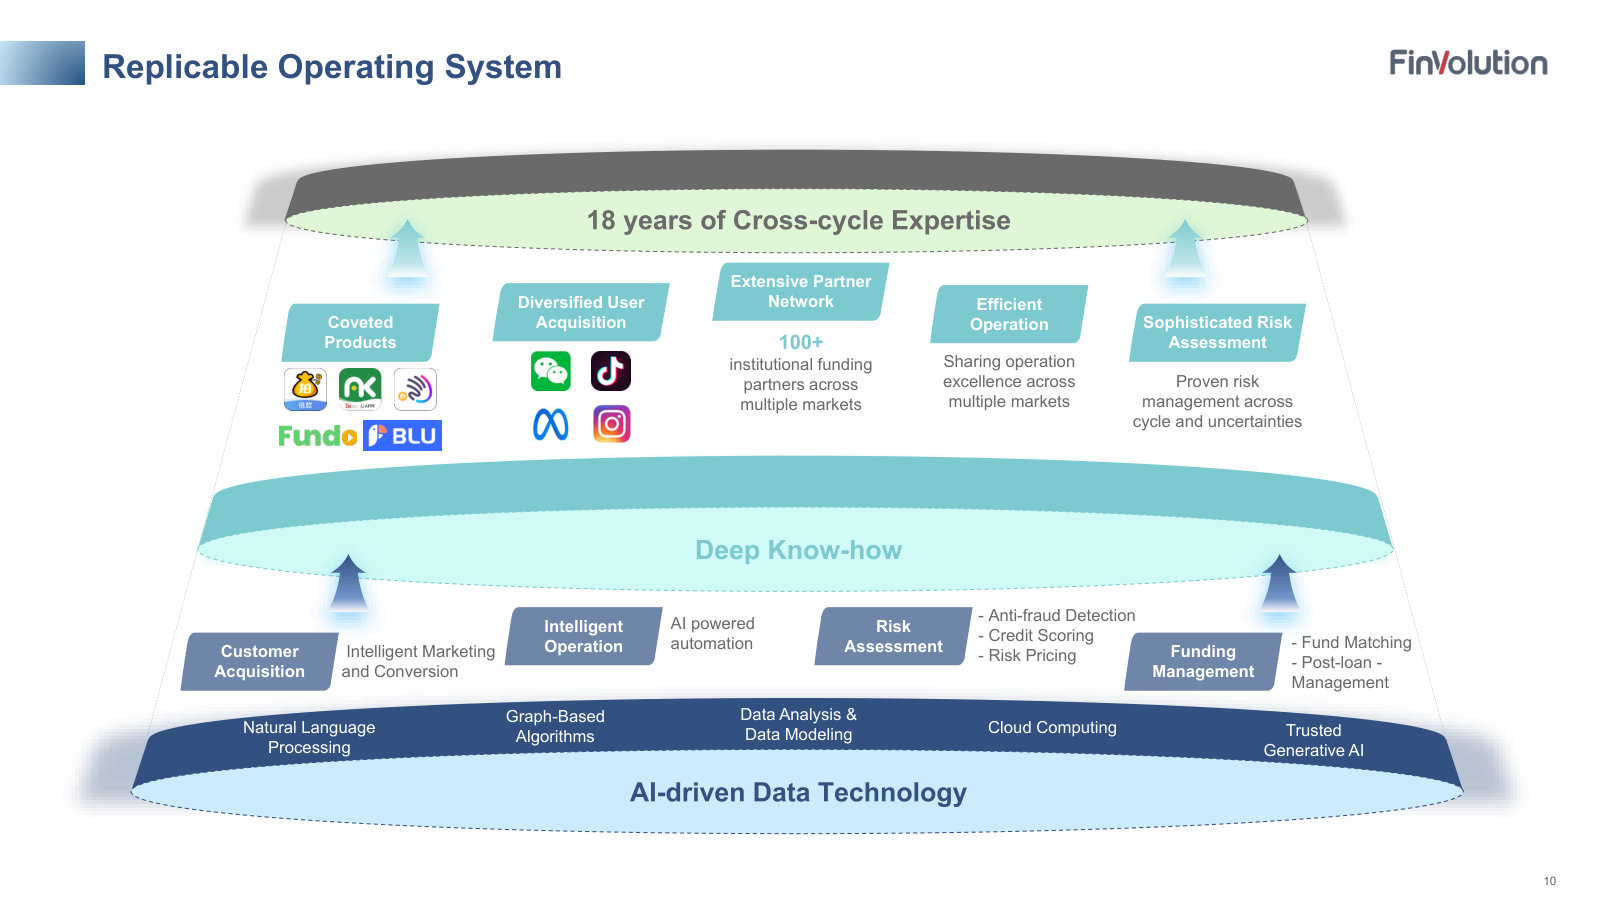
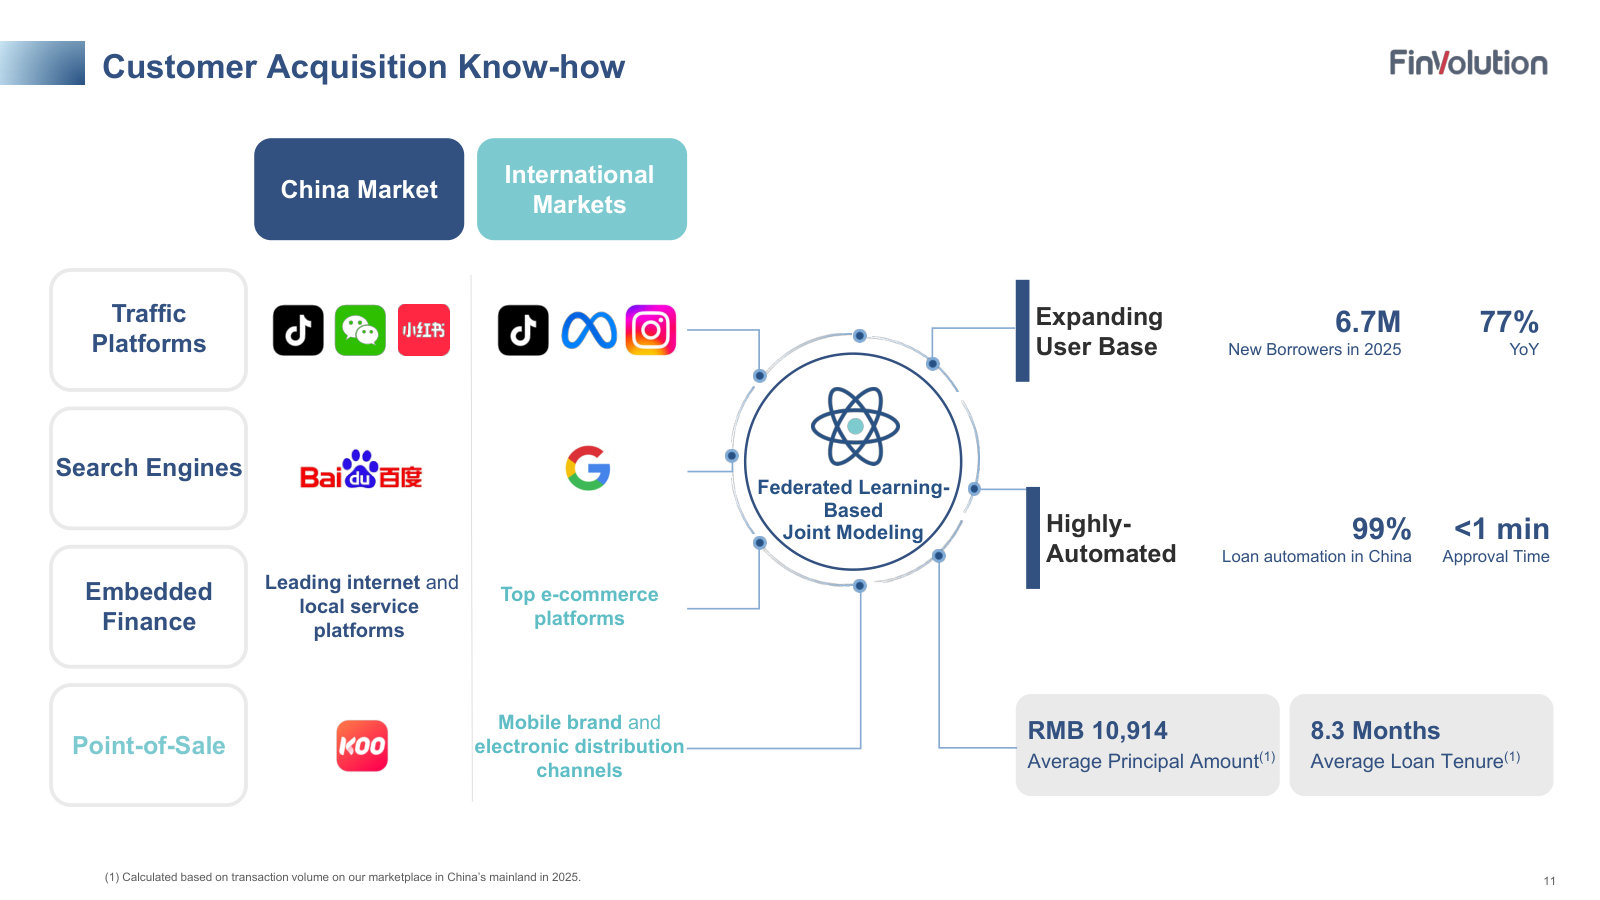
FinVolution Group's management explains the business in its own materials. The slides below do the most of that work, pulled from the documents preserved in Sources. Each source link opens the complete presentation at that slide in a new tab.
Investor Presentation — Q4 2025 / Full-Year 2025 — Q4 & FY2025
The newest and fullest deck: the three-country franchise, the growth strategy, the operating engine, risk and capital returns — a company overview in one document. · Open the full document →
Investor Presentation — Q3 2025 — Q3 2025
Featured for four explanatory slides the newest deck dropped — how the loan-facilitation model actually works, the market-penetration case, and the addressable market. · Open the full document →
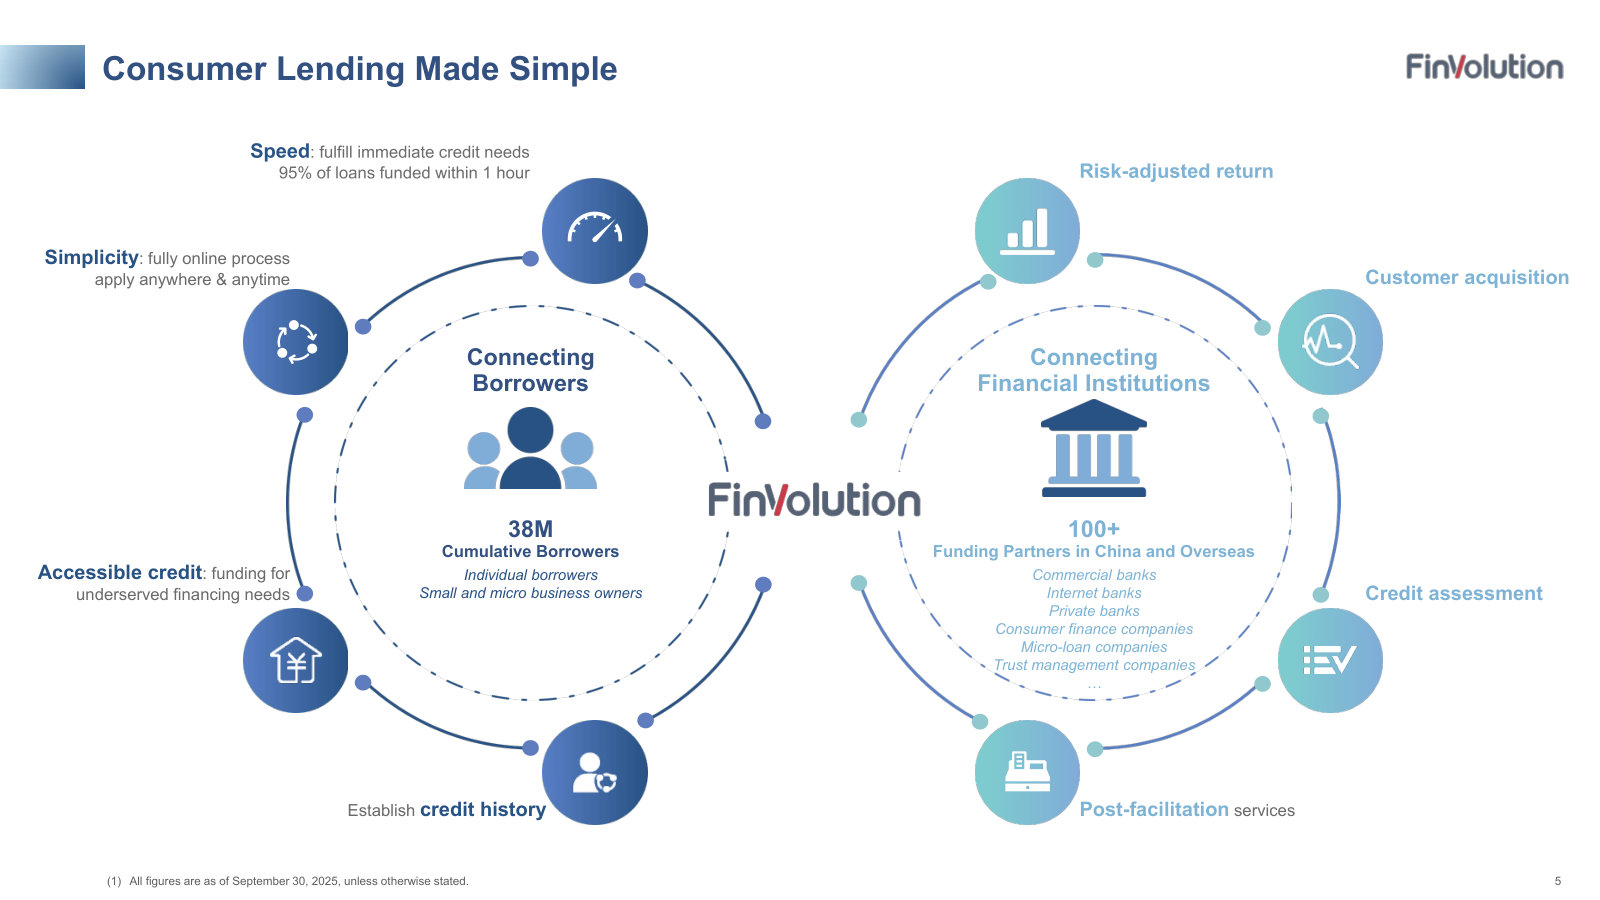
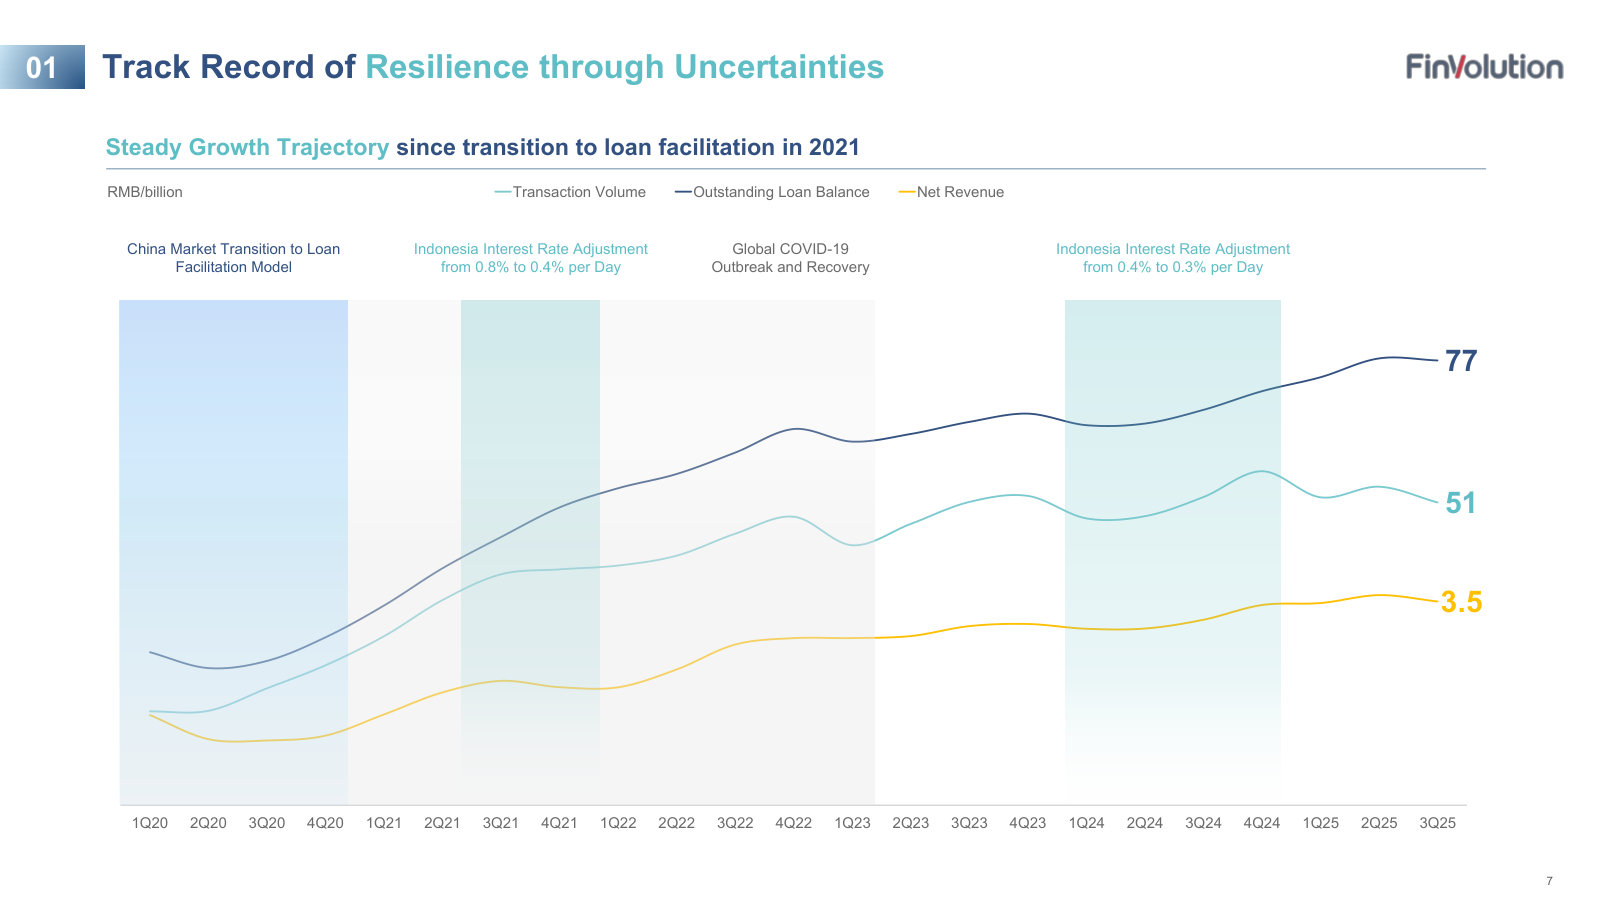
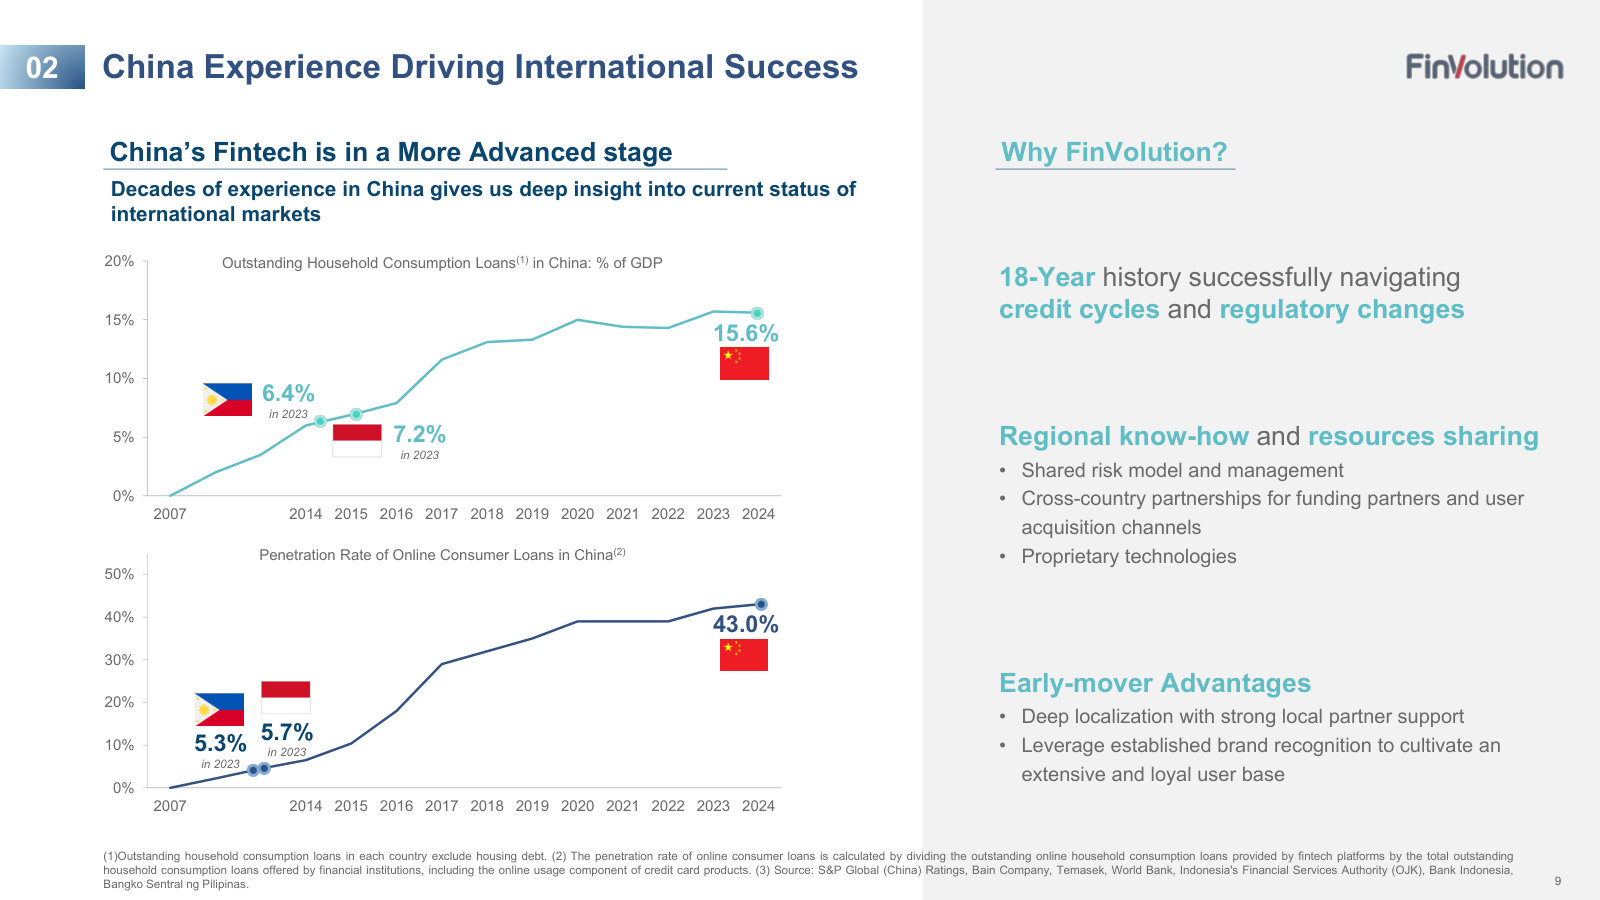
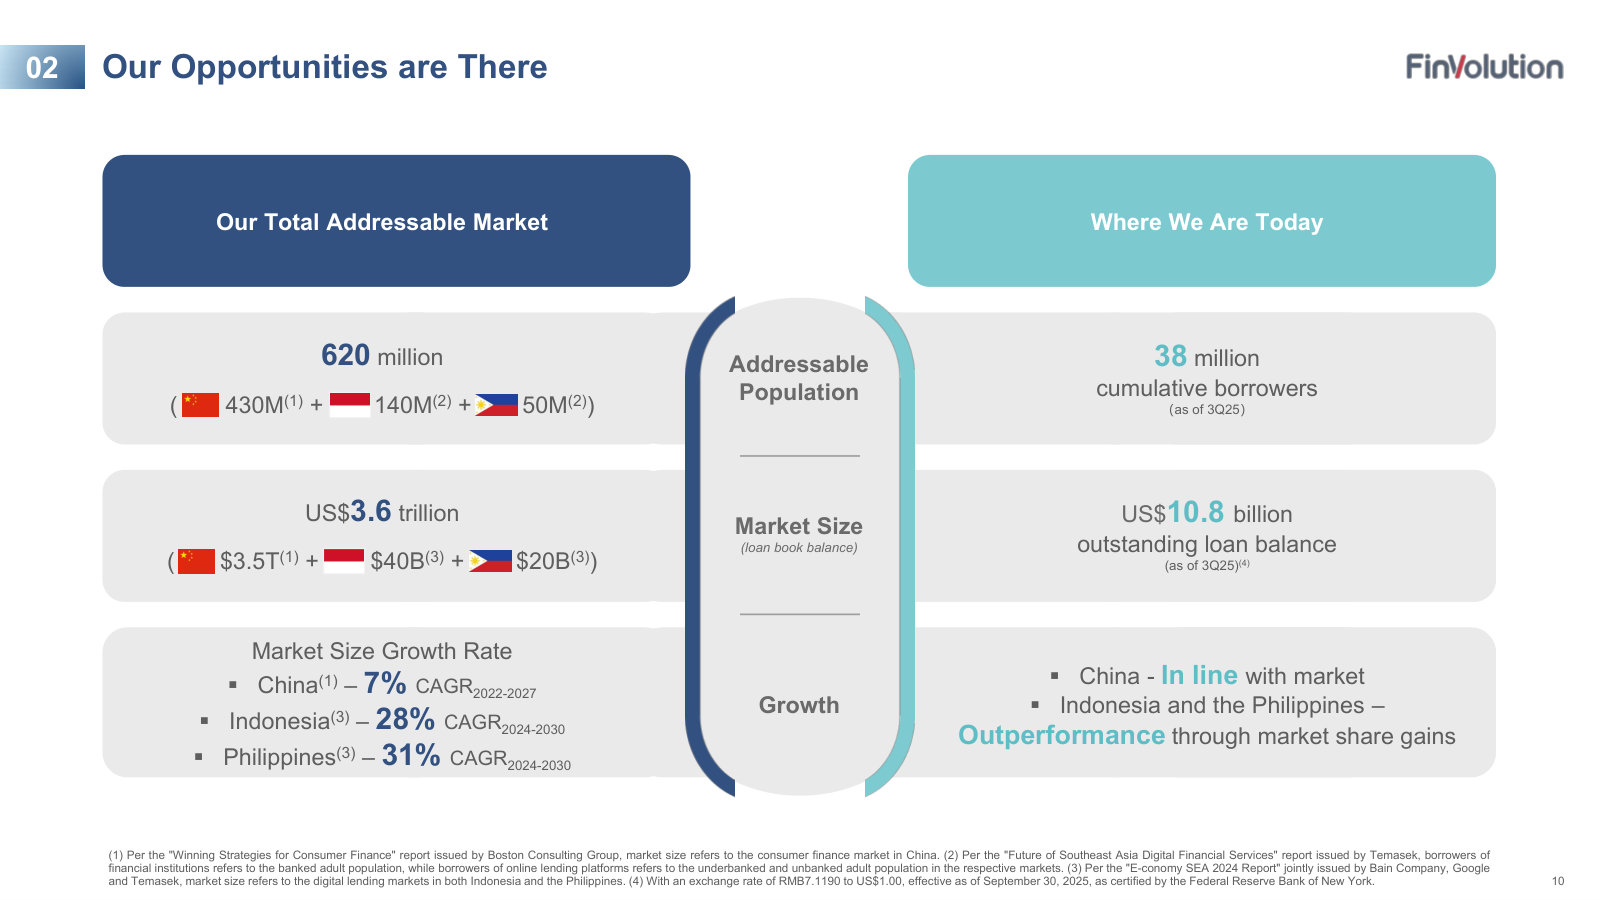
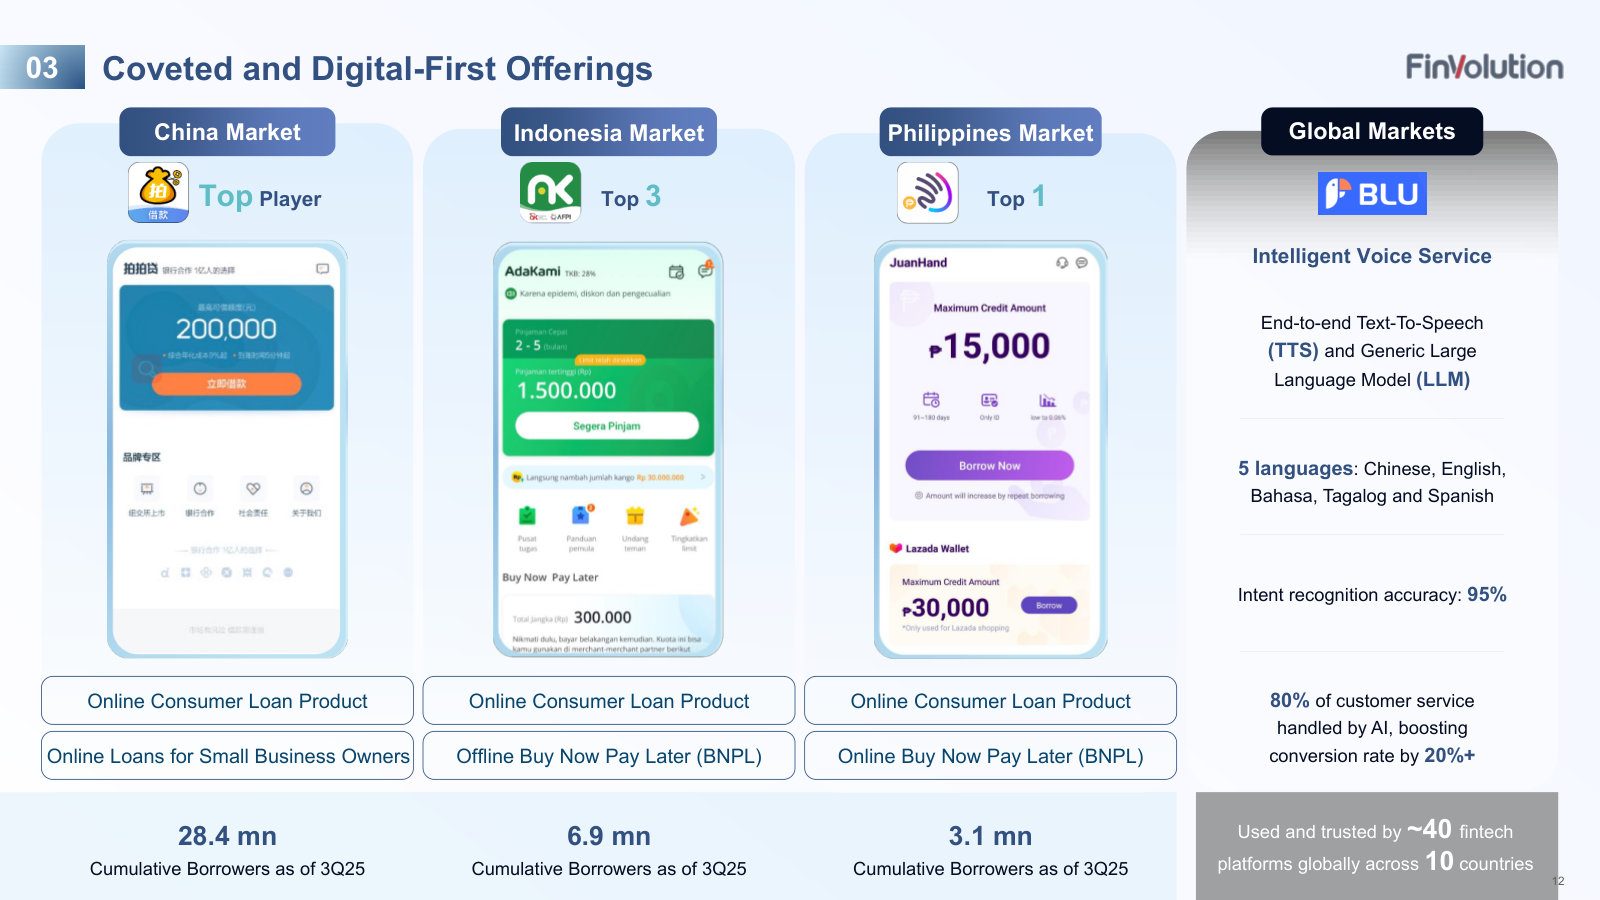
More from management
Investor Presentation — Q2 2025 — Q2 2025 · 27 pages · The mid-2025 interim data point, for readers tracking the quarter-by-quarter progression before the Q3 and full-year decks. · Open →
Investor Presentation — Q4 2024 / Full-Year 2024 — Q4 & FY2024 · 24 pages · The prior full-year review, with an explicit revenue-model slide (fees from funding partners) and leverage/liquidity detail the 2025 decks trimmed. · Open →
Investor Presentation — Q4 2022 / Full-Year 2022 — Q4 & FY2022 · 24 pages · The earliest deck on file, carrying a per-RMB100 unit-economics slide and balance-sheet detail that later editions dropped. · Open →
FinVolution Group's management answers for the business every quarter. These are the exchanges that explain it best — verbatim, from the call transcripts preserved in Sources. Each link opens the full transcript at that page in a new tab.
FinVolution Group Q1 2026 Earnings Call — Q1 FY2026
The most recent call, and the moment the story changed shape: overseas is broken out as a separate reportable segment — “a second profitable engine” — while China credit metrics turn up and a fresh US$150M buyback is authorized. · Open the full transcript →
The headline: overseas broken out as a separate reportable segment for the first time — “a second profitable engine” at 30% of revenue.
Tiezheng Li, CEO: Overseas markets again deliver 30% of group revenue this quarter. This is no longer only a diversification story. It has matured into a second profitable engine. To give investors a clearer view of this business, For the first time, we are disclosing our overseas business as a separate reportable segment. […] In the first quarter, overseas revenue reached RMB 949 million. up 35% year over year. Operating profit reached RMB 46 million up 88% year on year. This is a reflection of both the scale we have built and the earnings power that now stands on its own.
p. 6 · Read in context →
Why the new disclosure matters: segment-level EBITDA so investors can value each “engine” on its own metrics.
Jiayuan Xu, CFO: We are also introducing adjusted EBITDA for each segment. […] By separating the 2 engines. We make it easier for investors to value each segment on its own metrics and unlock the true value of the platform we have built.
p. 9 · Read in context →
Early recovery in China credit: take rate back to 3.2% and delinquencies easing across every vintage and collection metric.
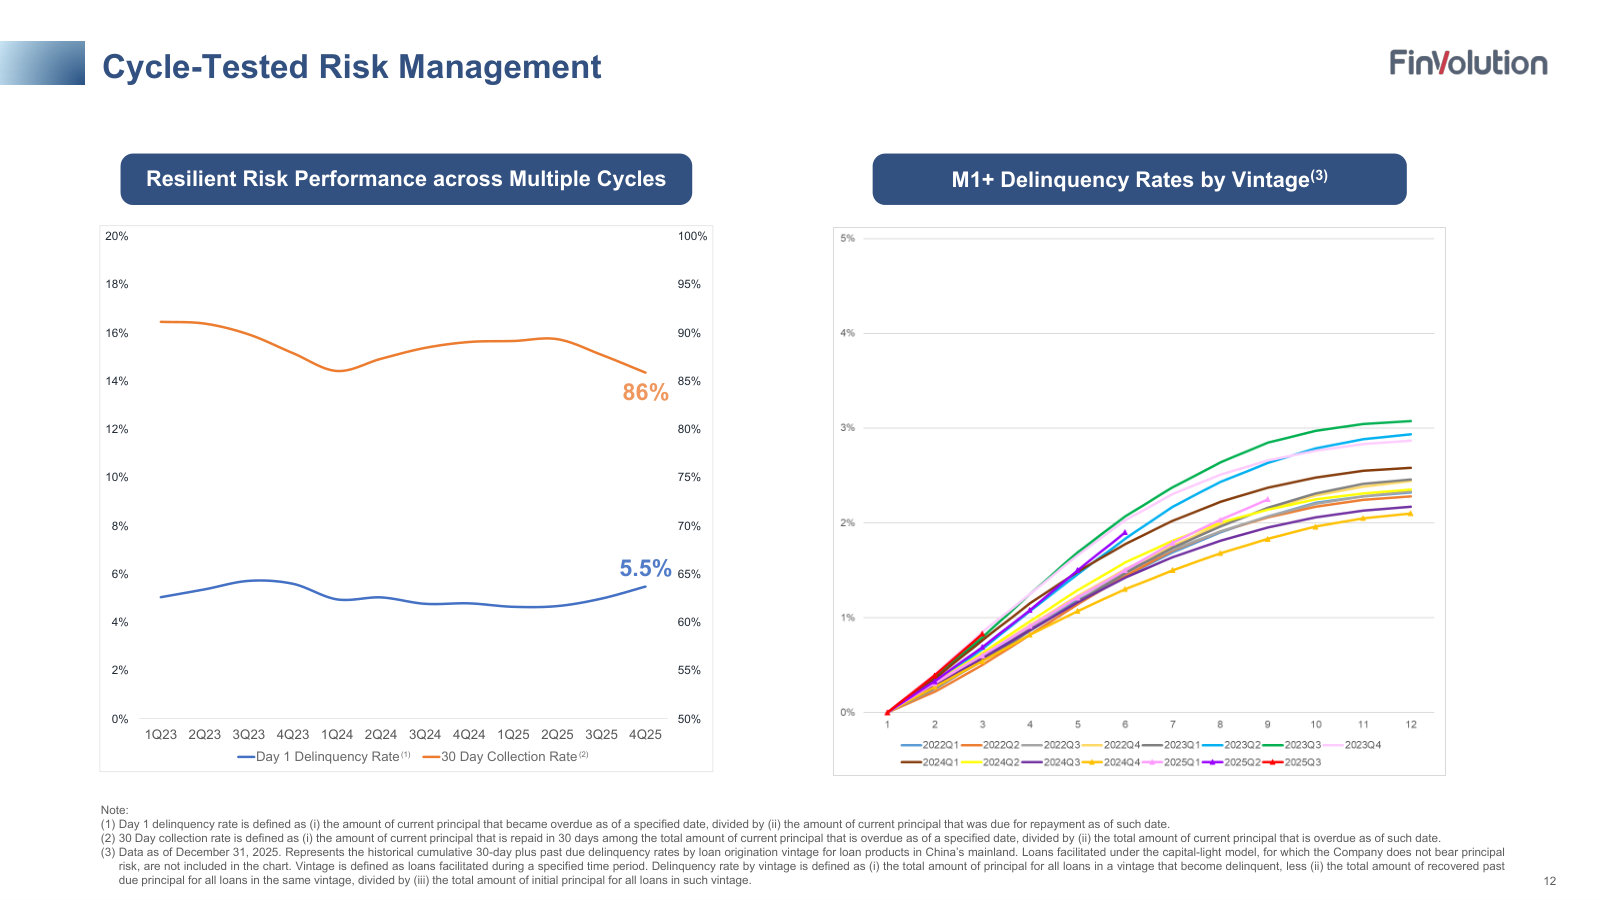
Jiayuan Xu, CFO: Net revenue came in at RMB 2.2 billion, up 7% sequentially. Take rate rose from 3% to 3.2% supported by better risk performance. On risk, the picture is consistent across indicators. In the first quarter, vintage delinquency eased from 3% to 2.7%. Day 1 delinquency improved from 5.5% to 5.2% The 30 day collection rate ticked up from 85.9% to 86.8%. As a result, M2 flow-through rate declined from 0.77% to 0.68%.
p. 9 · Read in context →
Capital-return continuity: ~US$54M repurchased year-to-date and a fresh US$150M buyback program authorized.
Jiayuan Xu, CFO: In the first quarter, we executed another $39 million and by the end of April, we have added another $15 million. So the total amount this year is about $54 million. And the remaining capacity and our current program is at about $20 million. […] With that as the backdrop, our board recently approved a new US$150 million program and also as for 2 years.
p. 12 · Read in context →
Positioning under China's new online-marketing rules: FinVolution supplies tech and data; licensed institutions make the credit call.
Tiezheng Li, CEO: The regulation reinforced that core financial decisions. Such as credit approval and the risk assessment, must rest with the licensed financial institutions. This has always been our model. We provide the technology and data tools Our partners make the final calls.
p. 13 · Read in context →
FinVolution Group Q4 & Full Year 2025 Earnings Call — Q4 FY2025
The full-year response to China's new consumer-finance rules: a resilient 2025, the first developed-market entry via the Fundo (Australia) acquisition, record buybacks with insider buying — and a guided 5–15% revenue decline for 2026. · Open the full transcript →
Full-year 2025 scorecard: net profit up 6.6% and international at 31% of Q4 revenue, even as volume slipped 2.9% under the new rules.
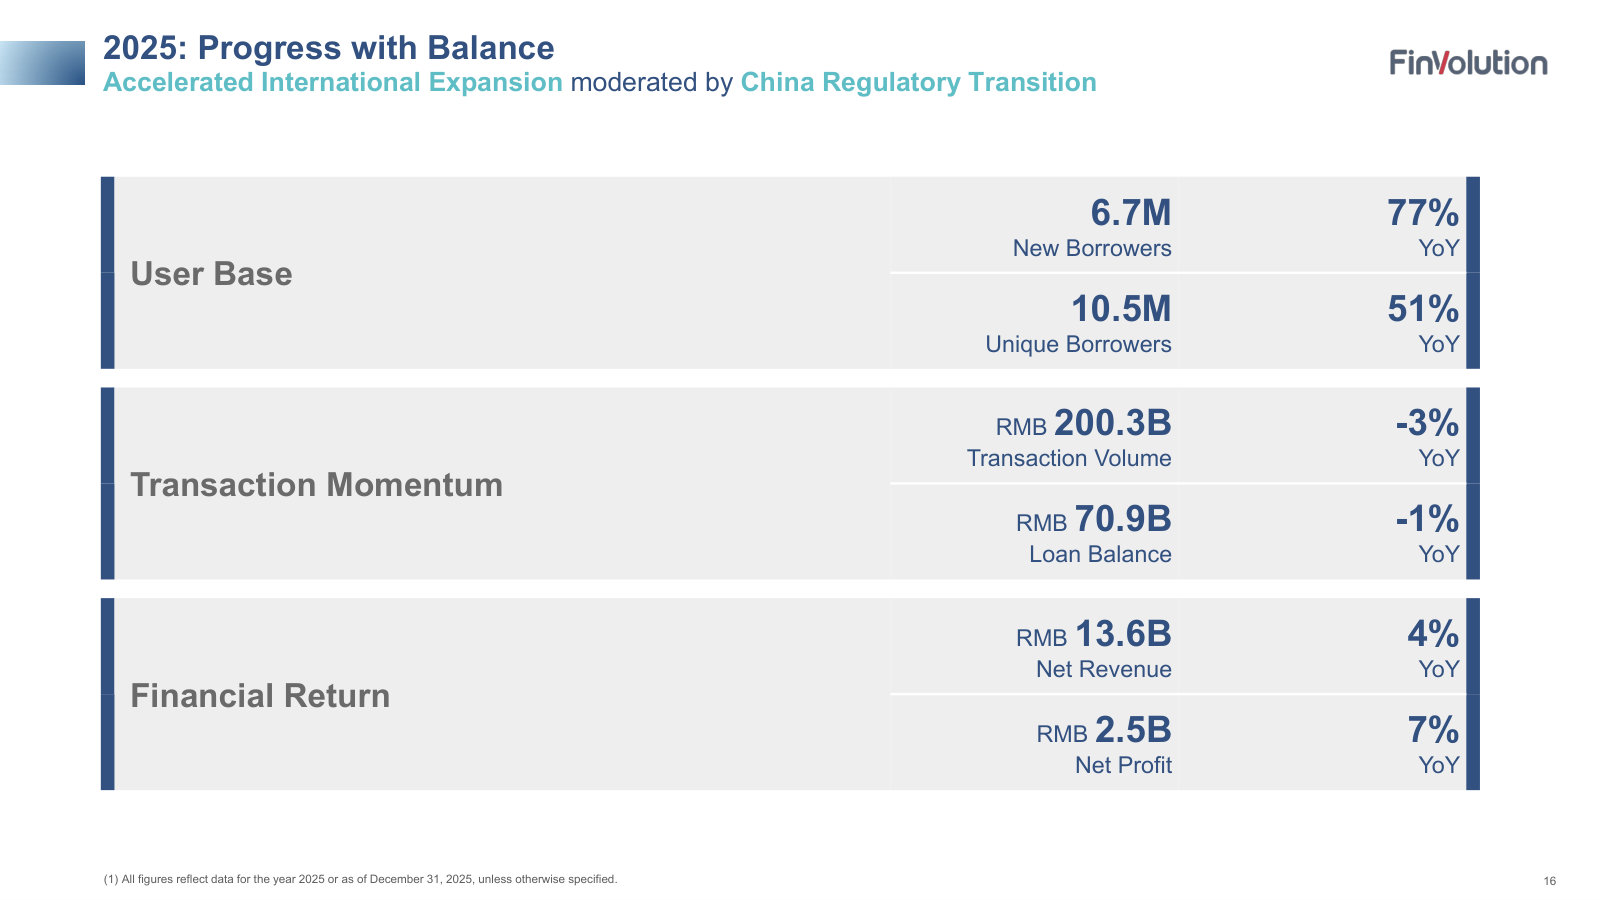
Tiezheng Li, CEO: Net profit also rose to RMB 2.5 billion, a 6.6% increase from last year. The resilient financial performance was achieved despite the regulatory uncertainty in China in the second half of the year, which tempered the full year transaction volume to RMB 200 billion, down 2.9% year-over-year. […] In 2025, our international business grew significantly. Our volume increased by 38.6% and revenue rose by 32.0% year-over-year. Most notably, international business contributed 31% of revenue for the quarter, significantly higher than 21% just a year ago.
p. 7 · Read in context →
The China playbook: deliberately prioritizing risk over origination, shrinking the loan book while underwriting tightens.
Tiezheng Li, CEO: New regulations reshaped the operating landscape in the fourth quarter, as discussed in our Q3 earnings session. We prioritized risk over loan origination in Q4. That means tightened underwriting and enhanced risk controls. The result is a near-term moderation of loan origination volume to RMB 38.7 billion and loan balance to RMB 68.3 billion in the fourth quarter.
p. 8 · Read in context →
The first developed-market step: acquiring Australian lender Fundo, extending the overseas playbook beyond Southeast Asia.
Tiezheng Li, CEO: In the fourth quarter, we entered the Australian market with the acquisition of a respected lending platform, Fundo. This new foray is a well-considered move that draws on our experience in maturing regulatory regime in China and operational excellence in overseas market.
p. 9 · Read in context →
Alignment on display: a record USD 107M buyback plus USD 1.9M of personal share purchases by the Chairman and management.
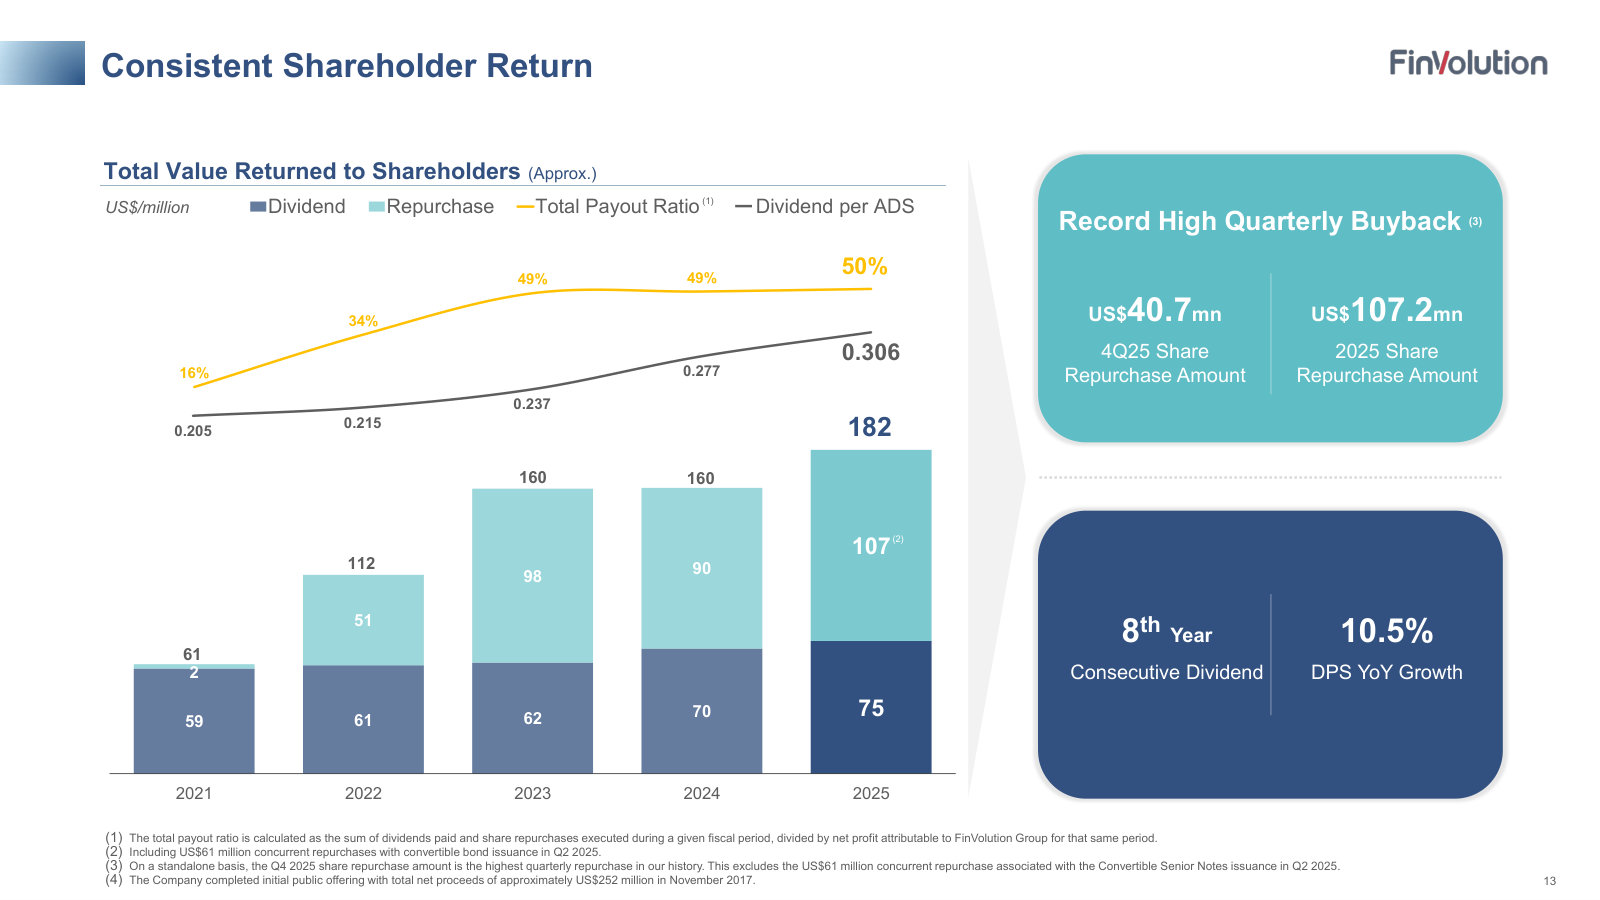
Tiezheng Li, CEO: We accelerated our buyback program this year with USD 107 million repurchased in 2025. It's a historical record since our IPO. This commitment is personal as well. In December, our Chairman and the management team recently invested an additional USD 1.9 million of their own capital in share buyback, a gesture of deep confidence in this journey we are on together.
p. 10 · Read in context →
Guidance philosophy: bracing for a 5–15% revenue decline in 2026 while holding the 50%-international-by-2030 goal.
Tiezheng Li, CEO: In light of the recent regulatory change in China, we expect full year 2026 group revenue to decline between 5% and 15% year-over-year. Our long-term goal remains to be 50% of revenue coming from international markets by 2030.
p. 13 · Read in context →
FinVolution Group Q3 2025 Earnings Call — Q3 FY2025
The regulatory-shock call — a new China consumer-finance framework takes effect Oct 1, 2025, guidance is cut, credit metrics turn, and management leans on the international “natural hedge” while buying back stock at 0.6x book. · Open the full transcript →
The two-engine thesis stated plainly — international as a “natural hedge,” a record 25% of revenue versus 19% a year earlier.
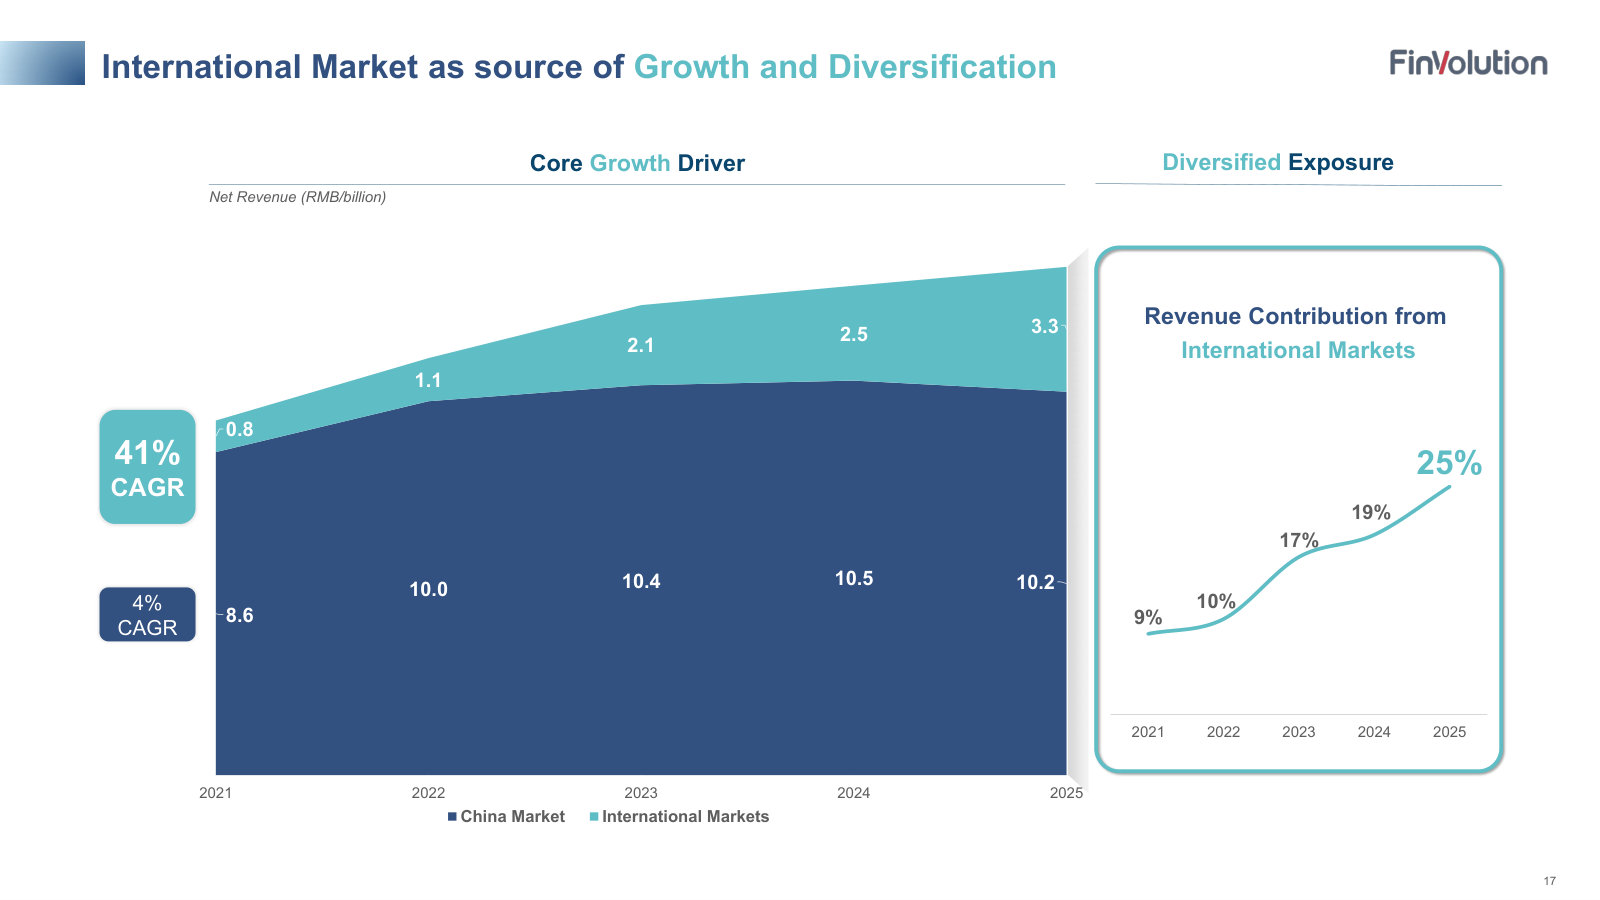
Tiezheng Li, CEO: In the third quarter of 2025, against a dynamic regulatory backdrop in China, we delivered another resilient result driven by robust growth in our international business. […] Our international segment continues to be an effective natural hedge to our China business, representing a record 25% of total revenue this quarter comparing to 19% a year earlier.
p. 2 · Read in context →
The shock, named: a new China consumer-finance framework effective Oct 1, 2025, with Q4 uncertainty flagged over volume, revenue and risk.
Tiezheng Li, CEO: Turning to China’s regulatory landscape, a new consumer finance regulation framework took effect on October 1, 2025. As expected, we saw transitional effects across the industry in the third quarter. Our response was proactive and disciplined. […] We anticipate that full implication of these regulations in the fourth quarter could create short-term uncertainties over volume, revenue and risk metrics, but this is not new to us.
p. 3 · Read in context →
The credit book turns: origination down 6.3% q/q, vintage loss and day-1 delinquency up, funding cost still easing.
Jiayuan Xu, CFO: Our loan origination volume contracted by 6.3% quarter over quarter. […] Our expected vintage loss trended from 2.5% to 2.9%. Day-1 delinquency rate showed similar trend, increasing from 4.7% last quarter to 5.0% this quarter, while our 30-day collection rate was down from 89% to 88%. On the bright side, market liquidity has improved while funding cost has been on a downward trend, improving from 3.7% last quarter to 3.6% this quarter.
p. 4 · Read in context →
Guidance philosophy under stress: full-year 2025 revenue growth trimmed to ~0–5% as the new regulation bites.
Jiayuan Xu, CFO: While our financial performance for the first 9 months ended September 30, 2025 remains generally in line with our revenue forecast for this period, the recent regulatory changes in China have introduced near-term uncertainties. […] We now expect full-year 2025 total revenue guidance to be in the range of approximately RMB 13.1 billion to RMB 13.7 billion, representing year-over-year growth of approximately 0% to 5%.
p. 5 · Read in context →
Capital allocation as the stock de-rates — buying back shares at 0.6x book value and 1.5x short-term liquidity.
Jiayuan Xu, CFO: And right now, with our stock trading at just 0.6x of our net book value, and only 1.5x of our short-term liquidity, in this situation, buying back our own shares is an effective way to create the value for our shareholders. That's why we are ramping up our buyback activity.
p. 7 · Read in context →
FinVolution Group Q4 & Full Year 2024 Earnings Call — Q4 FY2024
The pre-shock baseline: the clearest walk-through of how the loan-facilitation model makes money abroad, the 50%-international-by-2030 thesis, per-country unit economics, and the capital-return framework. · Open the full transcript →
The diversification thesis in one line: international revenue up from 3.7% (2020) to ~20% (2024), with a 50%-by-2030 target.
Tiezheng Li, CEO: As we've mentioned previously, we have set a target of reaching 50% of revenue from international markets by 2030 under our LE-GO strategy. I'm pleased to say that our strong strategic execution has paid off over the years, and our international operations have come a long way since 2018. Revenue contributions from international markets have increased rapidly, rising from 3.7% in 2020 to 10.3% in 2022, to around 20% in 2024.
p. 3 · Read in context →
How the overseas model works: migrating the Philippines book onto institutional loan-facilitation funding, 10%→70% in a year.
Tiezheng Li, CEO: We are the first platform in the country to introduce the concept of institutional funding through our loan facilitation model in 2024, with a list of reliable, trusted partners. We are also proud to share that the percentage of the loans facilitated by local financial institutions has grown from merely 10% in the first quarter of 2024 to around 70% in the fourth quarter of 2024.
p. 6 · Read in context →
Capital-return framework: the dividend policy floor lifted from ≥10% of net income to a 20–30% payout range from 2025 onward.
Jiayuan Xu, CFO: Recently, our board of directors approved our 7th annual dividend in the amount of US$0.277 per ADS, reflecting a DPS increase of 17% yearover-year. After thoughtful consideration, our board of directors have also approved the revision of dividend policy from no less than 10% of net income to between 20% to 30% of net income for 2025 onward, validating the company's commitment to enhancing shareholders value.
p. 7 · Read in context →
Per-country unit economics: Indonesia profitable and set to double, the Philippines crossing into profit in 2025.
Jiayuan Xu, CFO: In 2024, we achieved a profit of US$5 million in Indonesia, and in 2025, we expect that the profit from Indonesia will be at least double. And for our Philippines market, it was at loss in 2024 and we expect it will begin to make profits gradually in 2025.
p. 8 · Read in context →
More calls
Q2 FY2025 Earnings Call — Q2 FY2025 · 11 pages · The last call before October's regulatory shock — FY2025 guidance still intact at RMB14.4–15.0bn (+10–15%), international up to 22% of net revenue, and the OJK's confirmed Indonesia rate cap removing a long-running overhang. · Open →
Q1 FY2025 Earnings Call — Q1 FY2025 · 9 pages · China take-rate expansion plus 36% international volume growth; management reiterates the full-year 10–15% growth guide and a rising 25% international revenue mix. · Open →
Q3 FY2024 Earnings Call — Q3 FY2024 · 11 pages · A clean statement of the 50%-international-by-2030 ambition and the borrower-scale math (32.6M cumulative borrowers), before regulation dominated the narrative. · Open →
Q2 FY2024 Earnings Call — Q2 FY2024 · 10 pages · Mid-2024 checkpoint on the LE-GO strategy and the buyback track record (~US$260M deployed across two programs), with results landing inside the guidance range. · Open →
Q1 FY2024 Earnings Call — Q1 FY2024 · 10 pages · Sets the 2024 baseline — China volume guidance of RMB195.7–205bn and the shareholder-return cadence (US$62M dividend, ~US$100M buyback). · Open →
Q4 FY2023 Earnings Call — Q4 FY2023 · 20 pages · The FY2023 wrap — declaring leadership positions in Indonesia and the Philippines and a US$62M dividend / US$98M buyback, the template later years repeat. · Open →
Q3 FY2023 Earnings Call — Q3 FY2023 · 10 pages · Early articulation of the China-steady / international-fast barbell under uneven macro, at 29M cumulative borrowers. · Open →
Q2 FY2023 Earnings Call — Q2 FY2023 · 18 pages · The earliest call in the set — announcement of a US$150M buyback and a recap of the international build-out since the 2018 Indonesia entry. · Open →
FinVolution Group's annual reports contain management's most considered account of the business. These are the sections, passages and visual pages worth opening in the originals preserved in Sources.
FinVolution Group — FY2025 Annual Report (Form 20-F) — FY2025
Management's fullest account of a China-plus-overseas online lender whose 'capital-light' model still bears the credit risk it facilitates, run through a Cayman/VIE structure. · Open the full document →
Item 3.D. Risk Factors — We bear credit risk for the majority of loans funded by our institutional funding partners — p. 35 · Read the full section →
The crux of the model: despite the 'capital-light' framing, quality-assurance commitments leave FinVolution holding the default risk on most facilitated loans.
Quality-assurance commitments put credit risk back on FinVolution for a majority of the loans it facilitates.
We provide our institutional funding partners with quality assurance commitments for a majority of the loans they have funded. […] As a result, we are subject to credit risk for such loans. […] Any deterioration in our loan portfolio quality and increase in default risks could materially adversely affect our results of operations.
p. 35 · Read in context →
Item 3.D. Risk Factors — Risks Related to Our Corporate Structure (the VIE arrangements) — p. 51 · Read the full section →
The whole China business is consolidated through contracts, not ownership; if Beijing rejects the VIE structure the group could lose its operating entities.
The company concedes it cannot assure that regulators will accept the VIE contracts, and lists what a rejection could trigger.
Although we believe we, our PRC subsidiaries and the consolidated variable interest entities comply with current PRC laws and regulations, we cannot assure you that the PRC government would agree that our contractual arrangements comply with PRC licensing, registration or other regulatory requirements […] If the PRC government determines that we or the consolidated variable interest entities do not comply with applicable law, it could revoke the consolidated variable interest entities’ business and operating licenses, require the consolidated variable interest entities to discontinue or restrict the consolidated variable interest entities’ operations, restrict the consolidated variable interest entities’ right to collect revenues
p. 52 · Read in context →
Item 4. Information on the Company — B. Business Overview — p. 75 · Read the full section →
How the platform actually works: who it lends to, the 2020 pivot from balance-sheet lender to technology enabler, and how the capital-light fee is earned.
What the business is — a young-borrower-focused fintech spanning China and overseas markets.
We are a leading fintech platform with strong brand recognition across China and key overseas markets. Launched in 2007, we have been a pioneer in China’s online consumer finance industry. […] We strategically focus on serving borrowers of the young generation that is typically more receptive to internet financial services and whose borrowing needs are unserved or underserved by traditional financial institutions.
p. 75 · Read in context →
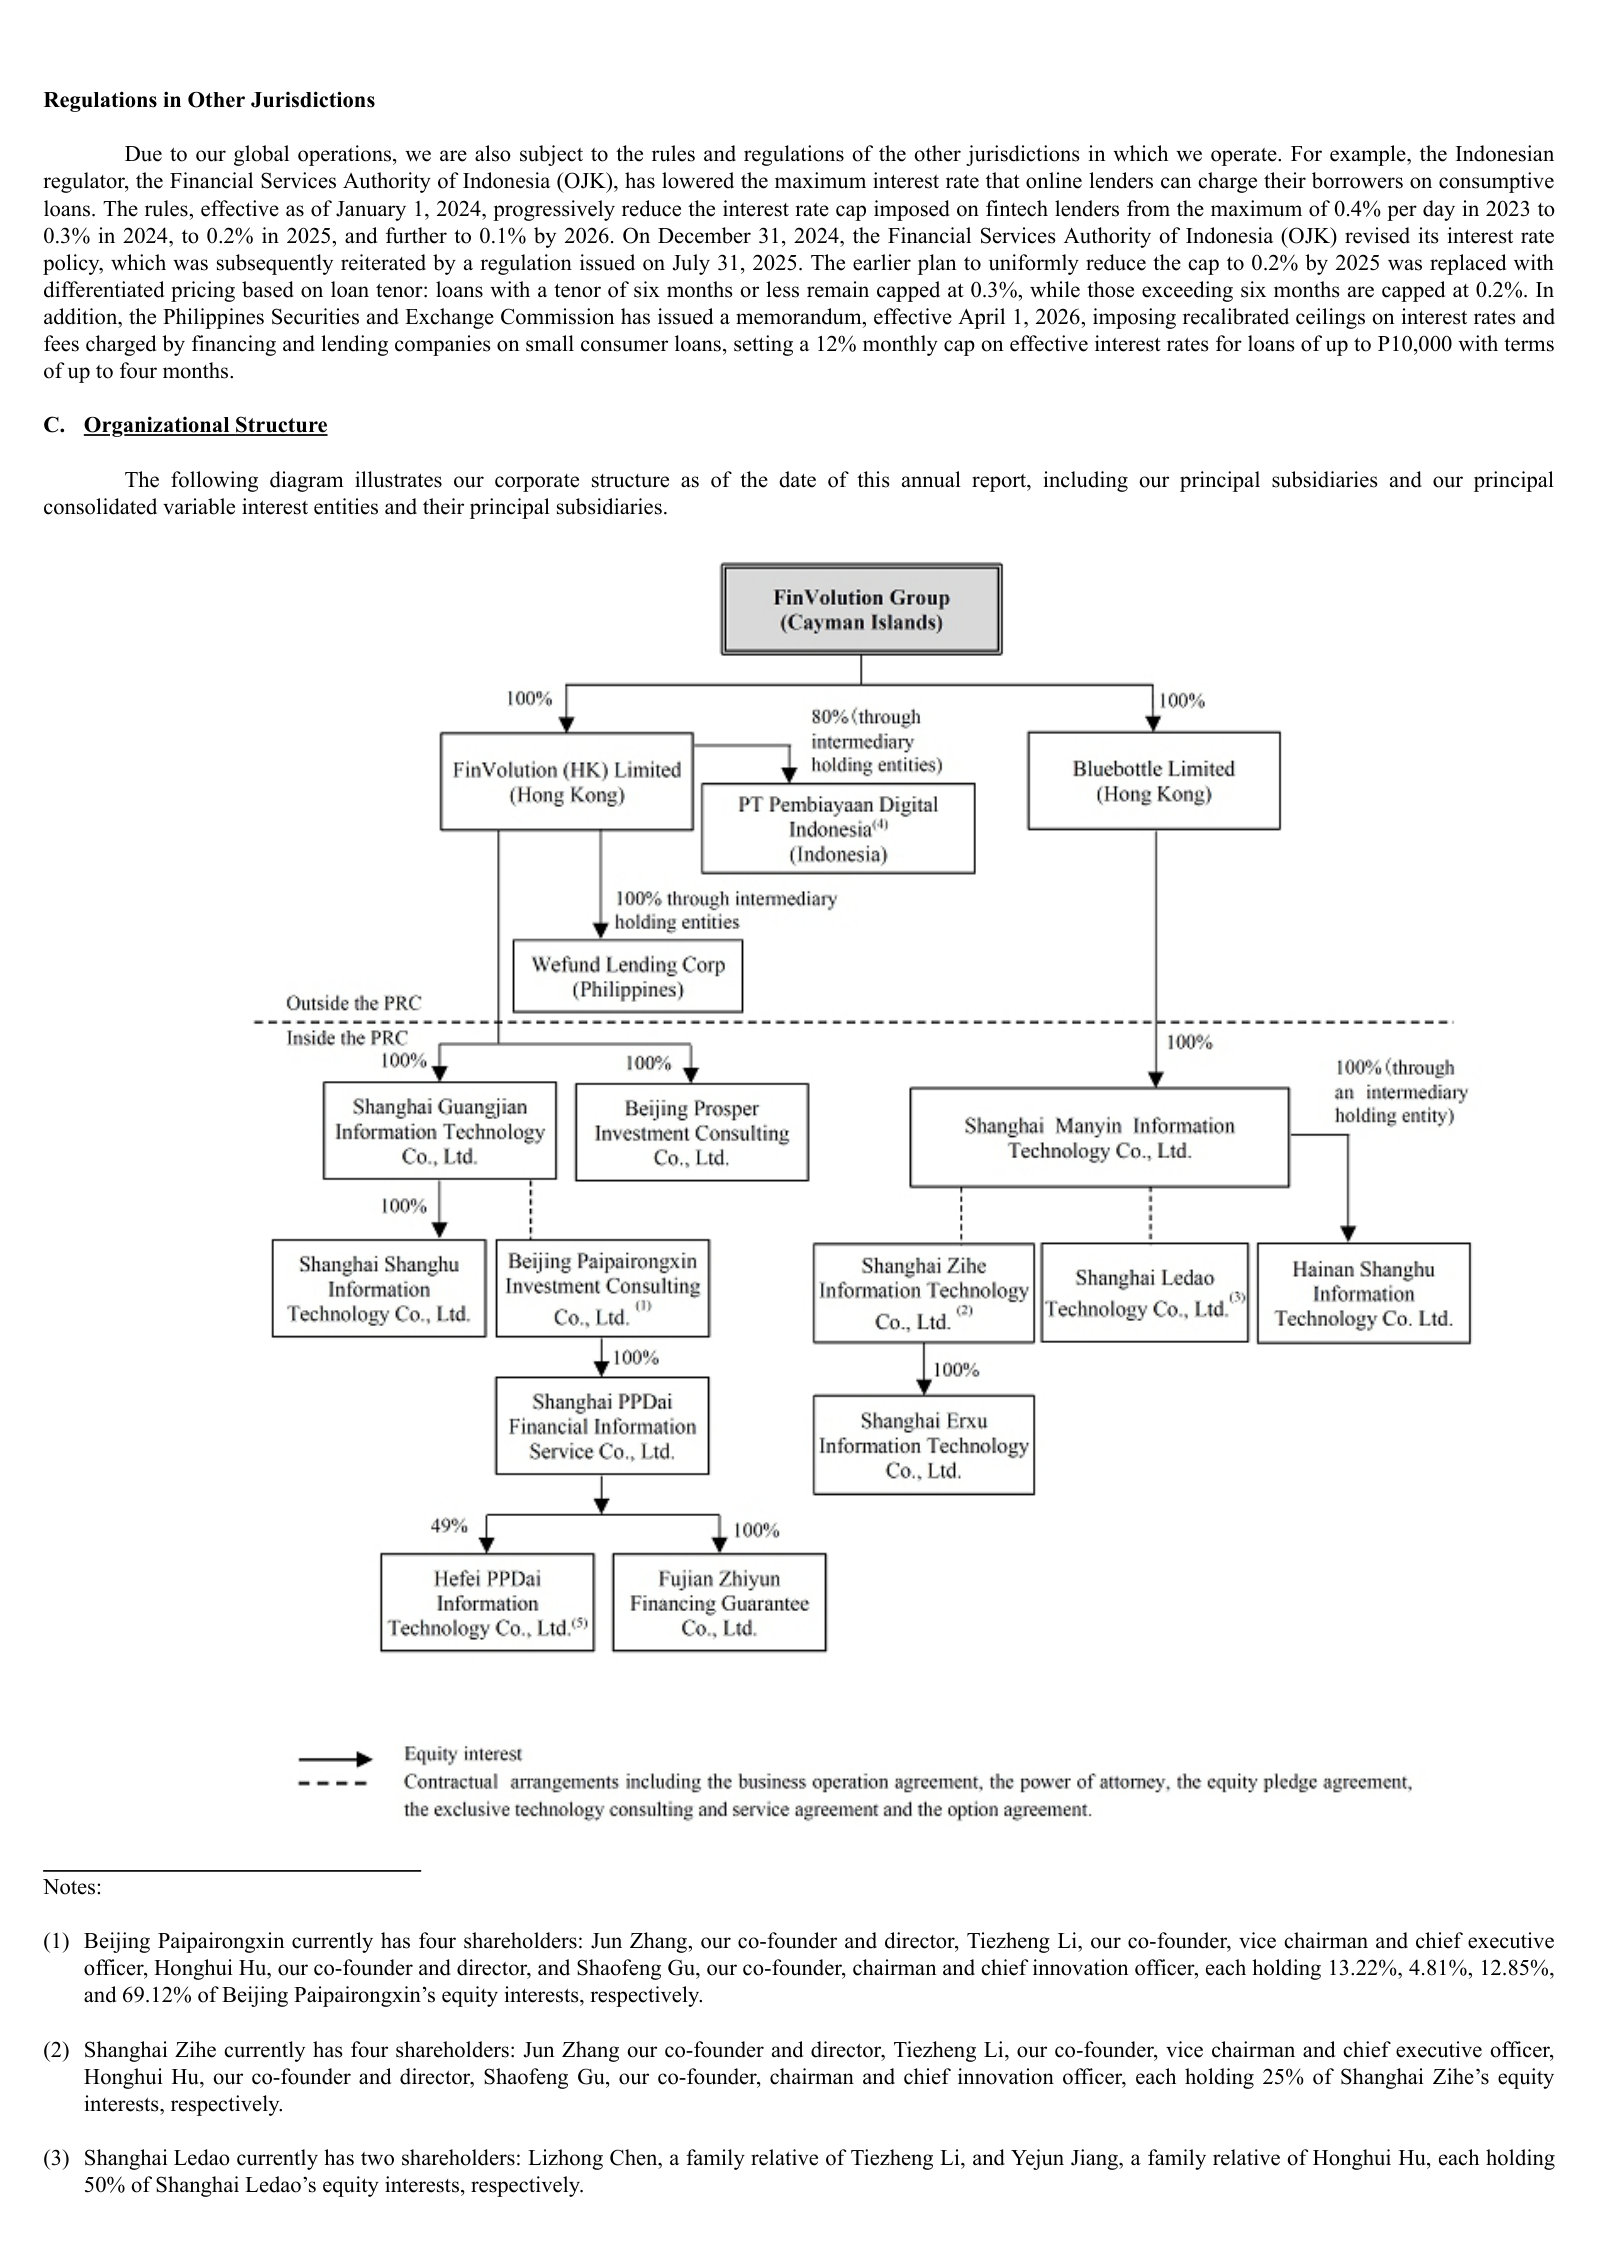
Item 4. Information on the Company — C. Organizational Structure — p. 101 · Read the full section →
The map of the Cayman parent, Hong Kong intermediaries, PRC subsidiaries and the consolidated VIEs — the structure behind the corporate-structure risk.
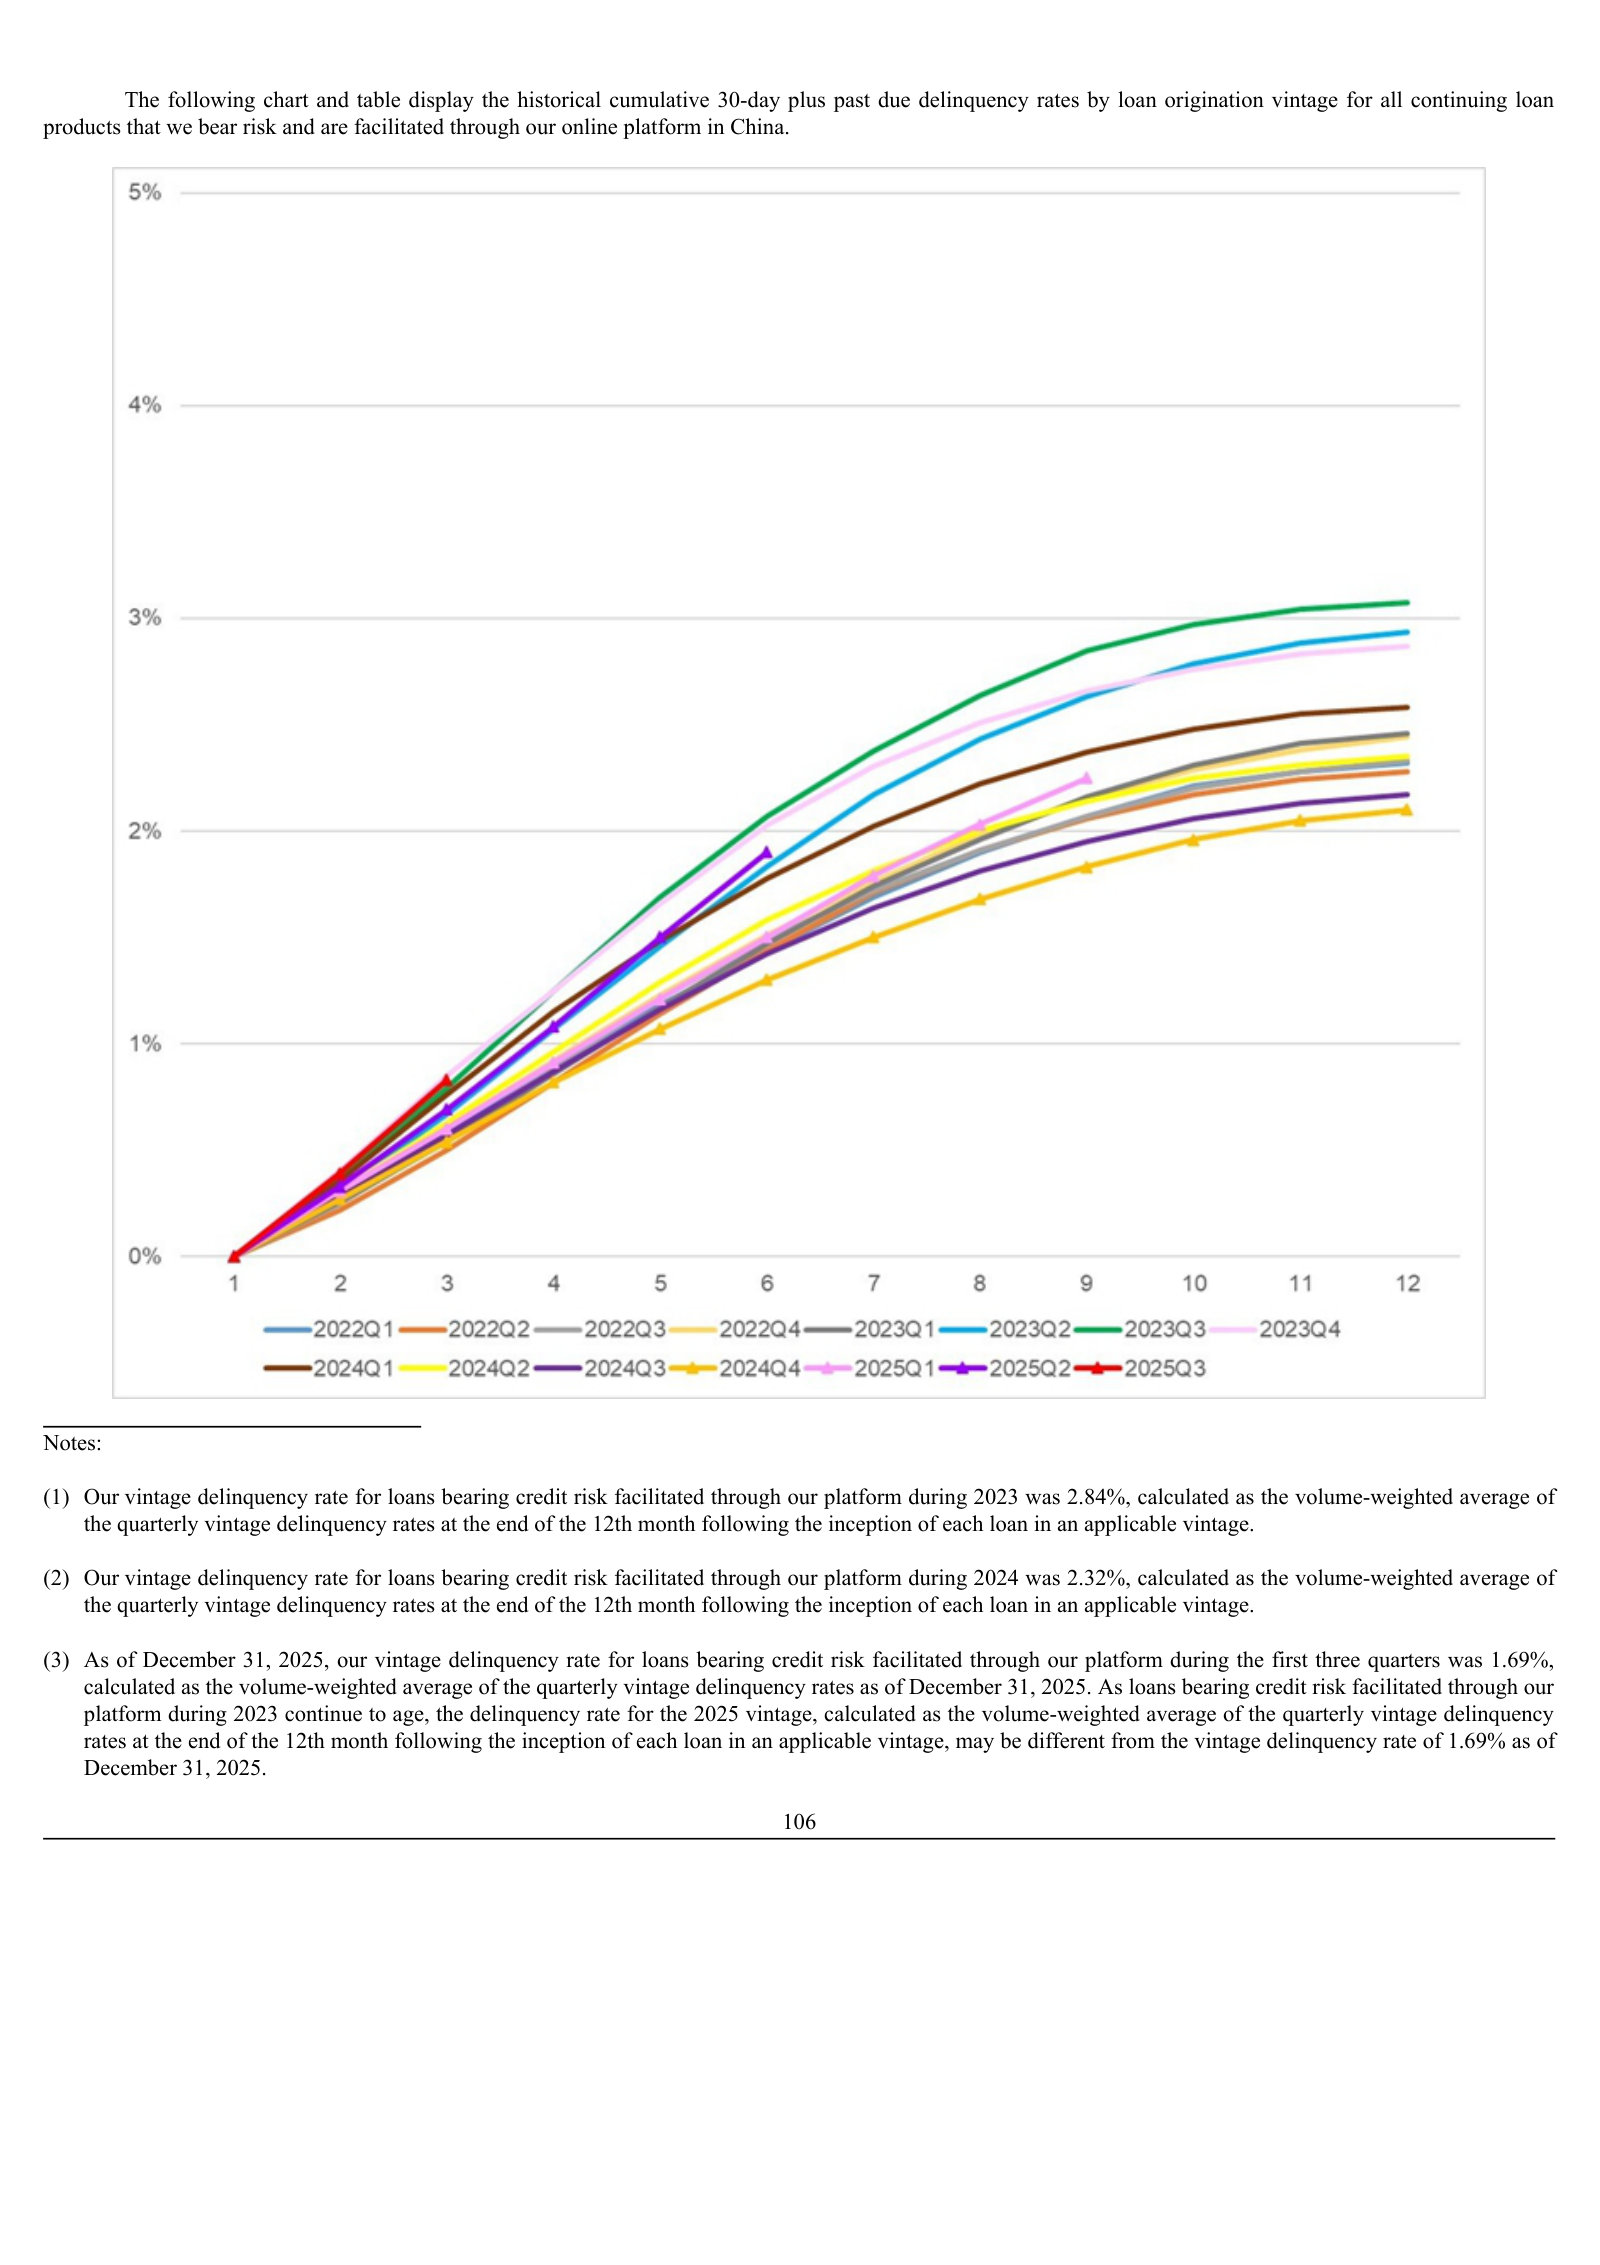
Item 5.A. Operating Results — Loan Performance Data — p. 111 · Read the full section →
For a lender, credit quality is the number that matters; the vintage curves show how risk-bearing China loans have seasoned across cohorts.
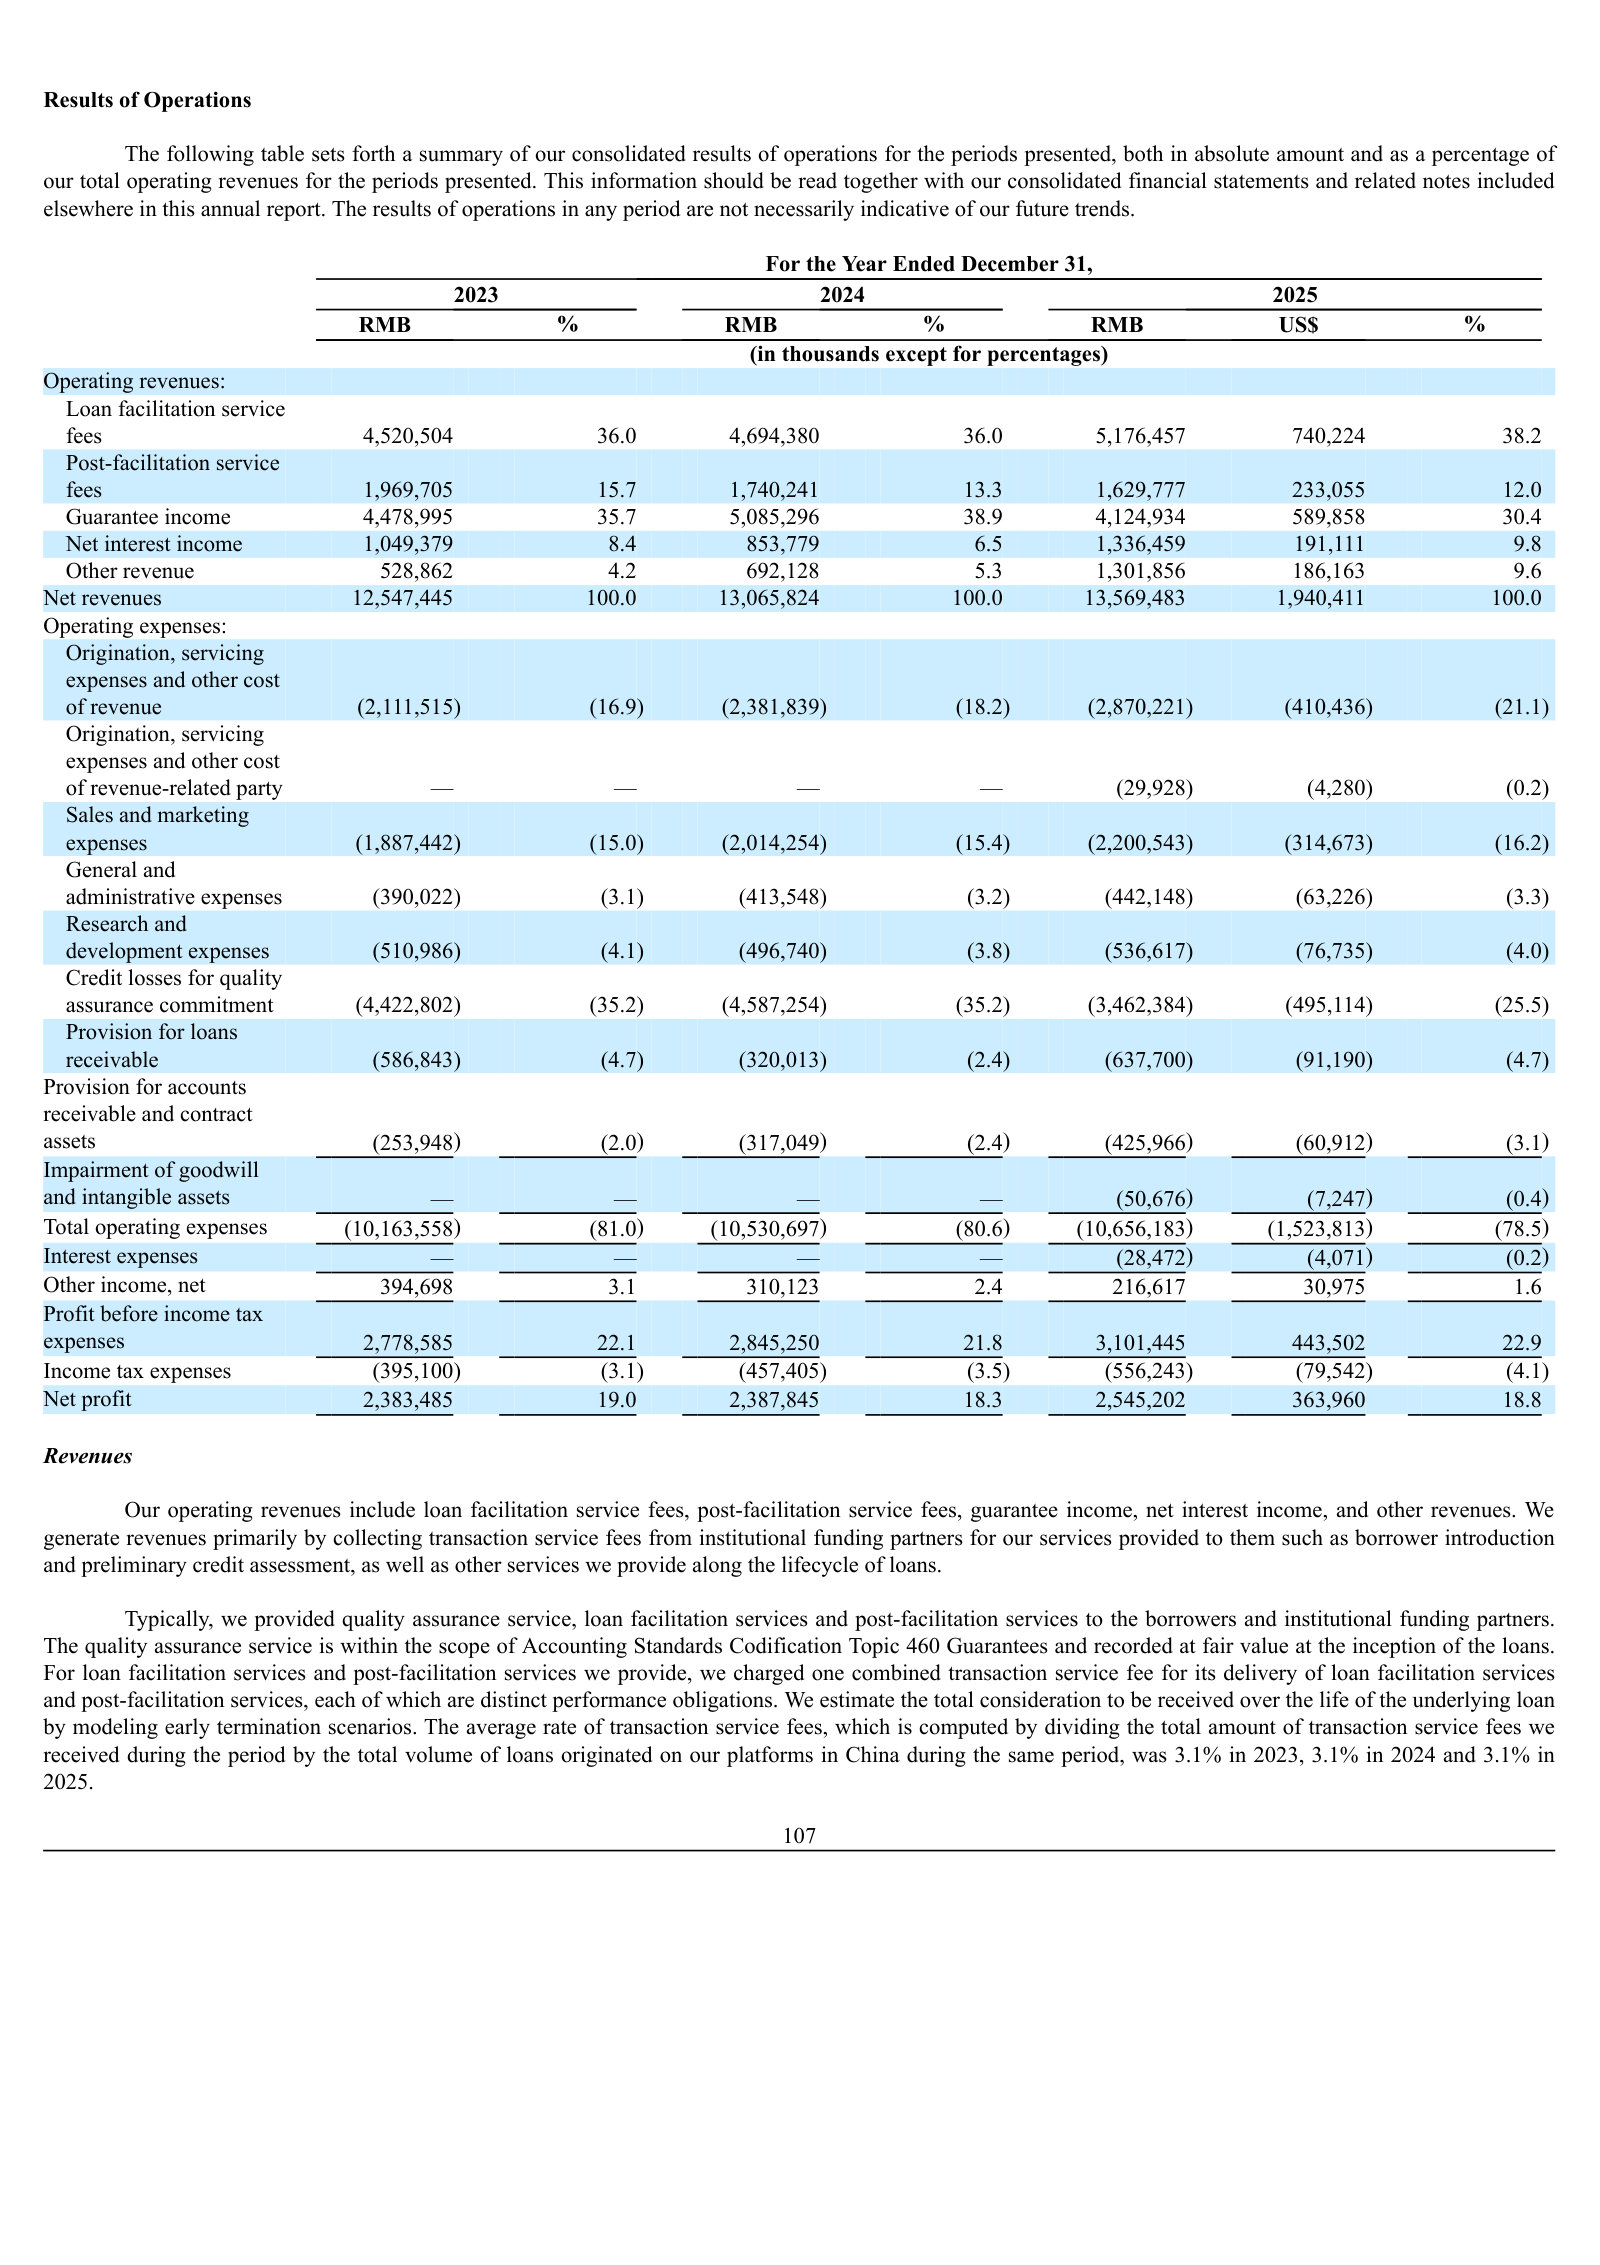
Item 5.A. Operating Results — Results of Operations — p. 113 · Read the full section →
Where management explains the revenue mix and what moved it — the shift from guarantee income toward facilitation and net interest income.
Note 2(s). Quality Assurance Obligations (Significant Accounting Policies) — p. 189 · Read the full section →
The accounting policy that defines the model: it converts the guarantee into deferred income and a credit-loss liability, which is why 'capital-light' still carries risk.
How the guarantee works and how it is booked — compensation obligation on default, income released as risk runs off.
For off-balance sheet loans funded by institutional funding partners, the Group provides quality assurance commitment to compensate them in the event of borrowers’ default […] the Group is obligated to compensate the third-party guarantee companies at an amount equal to the repayment made to the institutional funding partners. […] deferred guarantee income is released systematically as guarantee income in revenue in the consolidated statement of comprehensive income as the Group is released from the underlying risk.
p. 189 · Read in context →
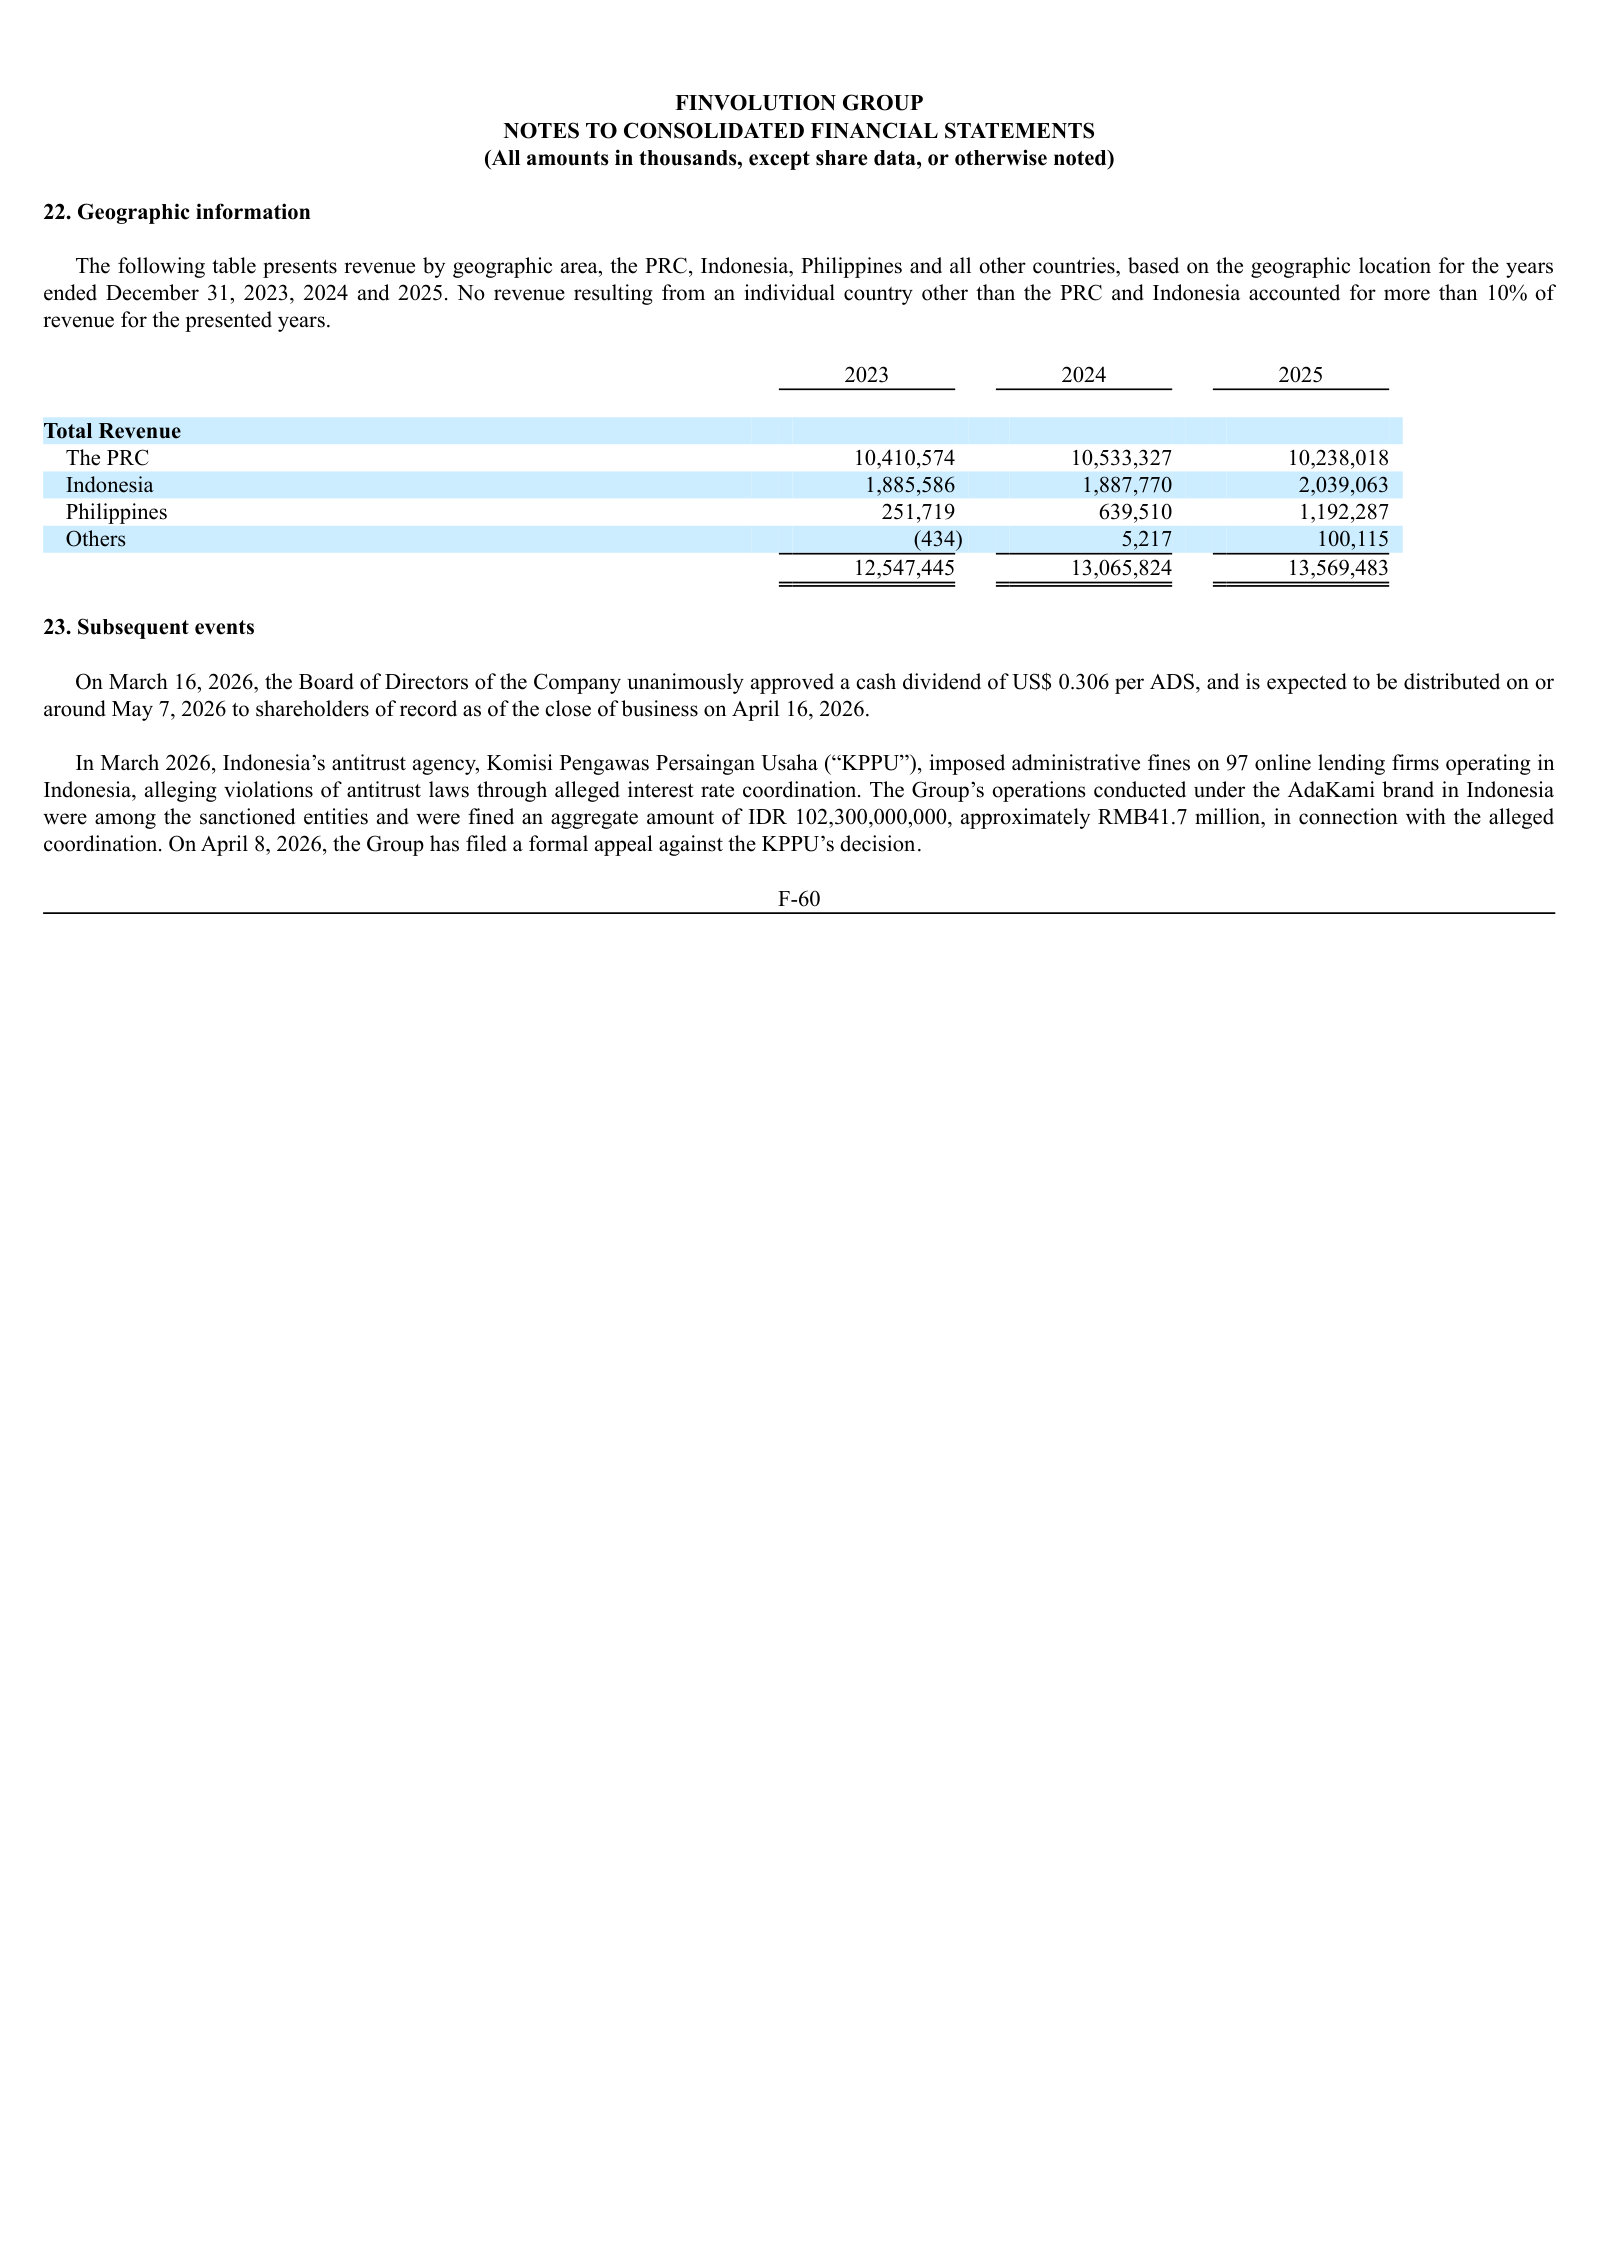
Note 22. Geographic Information — p. 221 · Read the full section →
The segment split in one table — China still ~75% of revenue while Indonesia and the Philippines scale; note the KPPU fine flagged just below.
More annual reports
FinVolution Group — FY2024 Annual Report (Form 20-F) — FY2024 · 260 pages · The year overseas expansion accelerated and the Indonesian multi-finance acquisition began — a useful baseline for the FY2025 international story. · Open →
FinVolution Group — FY2023 Annual Report (Form 20-F) — FY2023 · 215 pages · Shows the model mid-transition, with China still dominant before overseas revenue reached a quarter of the total. · Open →
FinVolution Group — FY2022 Annual Report (Form 20-F) — FY2022 · 273 pages · Captures the post-capital-light-pivot period and the earlier PRC regulatory tightening on online consumer lending. · Open →
FinVolution Group — FY2021 Annual Report (Form 20-F) — FY2021 · 270 pages · The earliest edition on the shelf — the capital-light model still new and China essentially the entire business. · Open →
Competitors describe FinVolution Group's market in their own filings and calls. These verified passages and visual pages show where their strategies meet, using source documents preserved in Sources.
Qifu Technology, Inc. (QFIN)
The largest listed Chinese credit-tech loan-facilitation platform and FinVolution's most direct scale rival — same core model of matching consumer borrowers with institutional funding partners, and the benchmark for volume, borrower reach and embedded-finance distribution.
Qifu states its cumulative loan-facilitation scale and borrower base in China — the entrenched incumbent FinVolution competes against.
As of December 31, 2024, we had cumulatively facilitated approximately RMB2,212.0 billion (US$303.0 billion) of loans to 34.4 million borrowers. As of the same date, we had 56.9 million users with approved credit lines, accumulatively.
p. 123 · Read in context →
Qifu's reported annual facilitation volume, showing a decline across 2022–2024 — the sector-wide contraction in China's consumer-credit market that FinVolution also faces.
In 2024, we facilitated RMB322.0 billion (US$44.1 billion) of loans, representing a decrease from RMB369.1 billion in 2023 and RMB330.7 billion in 2022.
p. 206 · Read in context →
Qifu describes its 'embedded finance' distribution — routing credit through short-video, e-commerce, ride-hailing and smartphone platforms — the traffic-partnership acquisition model that collides with FinVolution's own.
In 2020, we started cooperating with leading online platforms with heavy user traffic under "embedded finance" model. These platform partners include, among others, leading short-form video platform, e-commerce platforms, ride hailing companies and smart phone companies. In 2024, we started to explore collaborations with financial institutions to engage their existing customer bases, leveraging their proprietary traffic alongside our differentiated pricing and service capabilities to expand the breadth and depth of our user coverage.
p. 135 · Read in context →
LexinFintech Holdings Ltd. (LX)
A direct Chinese consumer-finance rival (Fenqile/installment lending) with a large registered-user base and the same AI/big-data risk-and-facilitation model FinVolution runs, contesting the same borrowers and institutional funders.
LexinFintech states its registered-user and credit-line user base and its target demographic — the consumer-finance customer pool it contests with FinVolution.
As of December 31, 2023, the total number of our registered users reached 210 million, and users with credit line reached 42 million, among whom over 85% are aged between 23 and 40 years old and over 65% were urban working population. […] The number of our cumulative active users reached 31.1 million in 2023.
p. 142 · Read in context →
LexinFintech's self-description as 'a leading consumer finance technology company in China' resting on AI/big-data risk management — essentially the same positioning FinVolution claims.
We are a leading consumer finance technology company in China with a decade-long operating history. Upholding financial risk management as our operational cornerstone, we strive to apply advanced technologies such as AI and big data to form an online risk assessment and management system based on quantitative decision-making.
p. 136 · Read in context →
LexinFintech's stated institutional funding-partner count and outstanding funding balance — the bank/consumer-finance funding base both firms depend on.
We had cumulatively served over 170 funding partners as of December 31, 2024. The outstanding balance of funds provided by institutional funding partners was RMB125.6 billion and RMB114.1 billion (US$15.6 billion) respectively as of December 31, 2023 and December 31, 2024.
p. 141 · Read in context →
X Financial (XYF)
The closest structural twin to FinVolution's China business — a personal-finance loan-facilitation platform connecting prime/near-prime borrowers with institutional funders via proprietary big-data risk technology, at comparable annual volume.
X Financial describes its model — connecting borrowers with institutional funding partners through proprietary big-data technology — nearly identical to FinVolution's loan-facilitation model.
X financial is a leading online personal finance company in China. We are committed to connecting borrowers on our platform with institutional funding partners. With proprietary big data-driven technology, we have established strategic partnerships with financial institutions across multiple areas of its business operations, enabling us to facilitate loans to prime borrowers under a robust risk assessment and control system.
p. 124 · Read in context →
X Financial defines its target as 'prime borrowers underserved by traditional financial institutions' — the same near-prime segment FinVolution serves.
We strategically target the prime borrowers underserved by traditional financial institutions. We believe we set a high standard of credit quality by defining our borrowers as prime borrowers, who we define as an individual having sound credit history, who have credit records with PBOC CRC and usually no late payment record of over 60 days in the previous six months.
p. 126 · Read in context →
X Financial's cumulative and annual active-borrower counts — the customer base it has built in the market FinVolution also serves.
We facilitated loans to 16,309,242 active borrowers, each of whom made at least one transaction on our platform during the period from the commencement of our loan facilitation business to December 31, 2024. The number of our active borrowers increased from 3,326,774 in 2022 to 4,495,997 in 2023 and then further increased to 5,231,887 in 2024.
p. 128 · Read in context →
Yiren Digital Ltd. (YRD)
A direct Chinese loan-facilitation rival that also collides with FinVolution offshore — it names the Philippines (FinVolution's JuanHand market) as an expansion front — and frames the domestic market as consolidating toward a few national players.
Yiren Digital notes it is expanding financial services overseas 'such as in the Philippines,' facing regional peers — a direct collision with FinVolution's JuanHand operation there.
Meanwhile, as we expand our financial service businesses overseas, such as in the Philippines, we are facing competition from regional peers. For our insurance brokerage business, our company and the VIEs compete with other insurance brokerage companies in China. Given the overall low penetration rate of insurance services in China compared with the US and the Europe, we believe that our strategic deployment in insurance business has navigated us towards a large market with high growth potential.
p. 35 · Read in context →
Yiren Digital's stated view that tightening regulation and rising entry barriers have thinned the field to a few national players, 'leaving more market share opportunities' — the consolidation thesis FinVolution also invokes.
For our financial services business, our company and the VIEs compete with other consumer finance marketplaces and loan facilitation platforms that were intensely competitive before the year 2018. However, as the domestic regulations on the industry evolve and entry barriers continue to increase in recent years, fewer national-level players like us remain in the market while smaller platforms cease their operations, leaving more market share opportunities for us.
p. 35 · Read in context →
Jiayin Group Inc. (JFIN)
A direct Chinese loan-facilitation rival pursuing the same international runway as FinVolution — it established an Indonesia office to lead Southeast Asia growth, the market FinVolution serves through AdaKami.
Jiayin describes pushing beyond China into developing markets, citing its Indonesia office and Southeast Asia expansion — the same offshore strategy FinVolution runs through AdaKami.
While we operate our businesses with a focus on the China market, we have been exploring opportunities in other developing countries with a significant size of low- to mid- income population in recent years and intend to continue to expand our businesses in international markets. For example, we established our Indonesia office in 2019 to supervise our rapid development in Southeast Asia and we increased our investments in Indonesia in recent years to explore more business opportunities in local markets.
p. 52 · Read in context →
Jiayin's reported 2024 facilitation volume and funding-partner count — its scale in the Chinese loan-facilitation market alongside FinVolution.
In 2024, we and the VIE Group facilitated an aggregate loan volume of RMB100.8 billion (US$13.8 billion), funded by 48 institutional funding partners.
p. 197 · Read in context →
Lufax Holding Ltd (LU)
One of China's largest retail-credit and small-business-lending platforms (Ping An-affiliated). Its tilt toward small-business owners makes the consumer overlap partial, but it maps the competitive arena and runs the same guarantee-backed facilitation model FinVolution uses.
Lufax names its competitors — MYbank, WeBank, Du Xiaoman Financial and JD Technology, plus traditional banks — mapping the consumer- and small-business-credit arena FinVolution also operates in.
We face competition in the SBO financial services industry and the consumer finance industry. The SBO financial services industry and the consumer finance industry in China is becoming increasingly competitive. We compete primarily with non-traditional financial service providers such as MYbank, WeBank, Du Xiaoman Financial and JD Technology and with traditional financial institutions, such as traditional banks, which are focused on retail and SMB lending.
p. 45 · Read in context →
More peer documents
Qifu Technology Q1 FY2026 earnings call — 25 pages · CEO Haisheng Wu on China's soft consumer-credit demand and a fifth straight quarterly decline in household short-term loan balances (p5) — sector backdrop (note: OCR-noisy Motley Fool transcript). · Open →
X Financial FY2025 20-F — updated facilitation volume — 362 pages · Total loans facilitated rose to RMB130.6 billion in 2025 from RMB104.9 billion in 2024 (p106) — a scale update showing XYF re-accelerating. · Open →
Yiren Digital FY2025 20-F — updated scale — 252 pages · Borrowers served rose to ~14.3 million and 2025 facilitation to RMB67.8 billion (p82) — a scale update on the direct rival. · Open →
Jiayin Group Q4/FY2025 earnings call — 18 pages · Management cites ~187% YoY growth in Indonesia facilitation volume and ~119% user growth (p4) — quantifies the AdaKami-market collision (OCR-noisy transcript). · Open →
Source: S&P Capital IQ consensus via Xpressfeed · Generated 2026-07-19.
Street snapshot
All six covering analysts rate FinVolution a buy, giving a consensus recommendation score of 1. Target prices span CNY 39.32 to 61.58, with a mean of about 49.26 across six estimates.
Currency: CNY · Scale: money in millions, absolute (per share) · Analyst counts shown explicitly; recommendation respondents: 6.
| Street view | Reading | Analysts |
|---|---|---|
| Recommendation mix | Buy 6, Outperform 0, Hold 0, Underperform 0, Sell 0 | 6 |
| Consensus score | 1.00 | 6 |
| Target price | mean 49.26; high 61.58; low 39.32 | 6 |
Forward table
Forward quarterly coverage is thin, limited mostly to dividend-per-share estimates.
Currency: CNY · Scale: money in millions, absolute (per share) · Analyst count is the estimate count for each period and metric.
| Period | Metric | Mean | YoY | Analysts | Low / high |
|---|---|---|---|---|---|
| FY0E | Revenue | 12,686 | -6.5% | 5 | 12,022 / 13,248 |
| FY0E | EBITDA | 2,339 | -24.6% | 1 | 2,339 / 2,339 |
| FY0E | EBIT | 2,261 | -22.5% | — | — / — |
| FY0E | Net income (GAAP) | 1,967 | -22.6% | 5 | 1,748 / 2,095 |
| FY0E | Net income (normalized) | 2,092 | -22.3% | — | — / — |
| FY0E | EPS (GAAP) | 8.18 | -14.7% | 4 | 7.84 / 8.46 |
| FY0E | EPS (normalized) | 8.31 | -18.1% | 4 | 7.84 / 9.07 |
| FY0E | Free cash flow | 533.0 | -68.0% | — | — / — |
| FY0E | Dividend per share | 2.08 | -13.9% | — | — / — |
| FY0E | Capital expenditure | -26.00 | 67.7% | — | — / — |
| FY0E | ROE | 11.9% | -25.2% | — | — / — |
| FY0E | Cash from operations | 3,159 | 55.8% | — | — / — |
| FY+1E | Revenue | 13,555 | 6.8% | 5 | 12,927 / 14,058 |
| FY+1E | EBITDA | 2,461 | 5.2% | 1 | 2,461 / 2,461 |
| FY+1E | EBIT | 2,576 | 14.0% | — | — / — |
| FY+1E | Net income (GAAP) | 2,309 | 17.4% | 5 | 2,176 / 2,507 |
| FY+1E | Net income (normalized) | 2,457 | 17.4% | — | — / — |
| FY+1E | EPS (GAAP) | 9.69 | 18.6% | 4 | 8.27 / 10.44 |
| FY+1E | EPS (normalized) | 9.75 | 17.3% | 4 | 8.27 / 11.07 |
| FY+1E | Free cash flow | 1,834 | 244.1% | — | — / — |
| FY+1E | Dividend per share | 2.43 | 16.9% | — | — / — |
| FY+1E | Capital expenditure | -27.50 | 5.8% | — | — / — |
| FY+1E | ROE | 12.5% | 4.8% | — | — / — |
| FY+1E | Cash from operations | 2,232 | -29.3% | — | — / — |
| FY+2E | Revenue | 14,779 | 9.0% | 3 | 14,165 / 15,248 |
| FY+2E | EBIT | 2,990 | 16.1% | — | — / — |
| FY+2E | Net income (GAAP) | 2,654 | 14.9% | 3 | 2,481 / 2,771 |
| FY+2E | Net income (normalized) | 2,829 | 15.1% | — | — / — |
| FY+2E | EPS (GAAP) | 11.33 | 16.9% | 3 | 11.02 / 11.52 |
| FY+2E | EPS (normalized) | 11.18 | 14.7% | 3 | 10.00 / 12.08 |
| FY+2E | Free cash flow | 2,370 | 29.2% | — | — / — |
| FY+2E | Dividend per share | 2.66 | 9.1% | — | — / — |
| FY+2E | Capital expenditure | -20.00 | -27.3% | — | — / — |
| FY+2E | ROE | 12.6% | 0.9% | — | — / — |
| FY+2E | Cash from operations | 2,390 | 7.1% | — | — / — |
| Q3 FY2024 | Dividend per share | 0.00 | — | — | — / — |
| Q4 FY2024 | Dividend per share | 2.05 | — | — | — / — |
| Q2 FY2025 | Dividend per share | 0.00 | — | — | — / — |
| Q3 FY2025 | Dividend per share | 0.00 | — | — | — / — |
Estimate momentum
FY2028 estimates were nudged lower on a similar path, so the revisions are broad rather than a single-period move.
Currency: CNY · Scale: money in millions, absolute (per share) · Point-in-time consensus; analyst count is shown where supplied.
| Period | Metric | Lookback | Then | Now | Direction / magnitude | Analysts |
|---|---|---|---|---|---|---|
| 2028 | Revenue | 30d | 14,779 | 14,779 | flat 0.0% | — |
| 2028 | Revenue | 90d | 15,175 | 14,779 | down 2.6% | — |
| 2028 | EPS (normalized) | 30d | 11.18 | 11.18 | flat 0.0% | — |
| 2028 | EPS (normalized) | 90d | 11.37 | 11.18 | down 1.7% | — |
| 2027 | Revenue | 30d | 13,829 | 13,555 | down 2.0% | — |
| 2027 | Revenue | 90d | 14,051 | 13,555 | down 3.5% | — |
| 2027 | Revenue | 180d | 14,384 | 13,555 | down 5.8% | — |
| 2027 | EPS (normalized) | 30d | 10.10 | 9.75 | down 3.5% | — |
| 2027 | EPS (normalized) | 90d | 10.00 | 9.75 | down 2.6% | — |
| 2027 | EPS (normalized) | 180d | 10.59 | 9.75 | down 7.9% | — |
Beat / miss record
Current sequences by metric: Revenue: 2 consecutive misses; EPS (normalized): 3 consecutive beats.
Currency: CNY · Scale: money in millions, absolute (per share) · Consensus is captured before each actual first became effective; analyst count shown per observation.
| Quarter | Metric | Consensus as of | Actual | Surprise | Outcome | Analysts |
|---|---|---|---|---|---|---|
| Q4 FY2025 | Revenue | 3,078 | 3,024 | -1.8% | Miss | — |
| Q4 FY2025 | EPS (normalized) | 1.61 | 1.77 | 9.9% | Beat | — |
| Q3 FY2022 | Revenue | 2,800 | 2,525 | -9.8% | Miss | — |
| Q2 FY2022 | Revenue | 2,600 | 2,666 | 2.5% | Beat | — |
| Q4 FY2021 | EPS (normalized) | 2.00 | 2.36 | 18.0% | Beat | — |
| Q1 FY2020 | Revenue | 650.9 | 2,106 | 223.6% | Beat | — |
| Q1 FY2020 | EPS (normalized) | 0.21 | 1.36 | 540.0% | Beat | — |
| Q4 FY2019 | Revenue | 1,114 | 1,233 | 10.7% | Beat | — |
| Q4 FY2019 | EPS (normalized) | 1.32 | 1.32 | -0.1% | Miss | — |
Where the street disagrees
Disagreement is concentrated in the out-year normalized EPS, where FY2027 spans CNY 8.27 to 11.07 (standard deviation ~1.02). Estimate counts there are small — four or fewer — and single-broker items such as EBITDA weaken the signal further.
Currency: CNY · Scale: money in millions, absolute (per share) · Dispersion is high-low divided by absolute mean; analyst count shown per item.
| Period | Metric | Mean | Low | High | Spread / mean | Analysts |
|---|---|---|---|---|---|---|
| 2027 | EPS (normalized) | 9.75 | 8.27 | 11.07 | 28.8% | 4 |
| 2027 | EPS (GAAP) | 9.69 | 8.27 | 10.44 | 22.4% | 4 |
| 2028 | EPS (normalized) | 11.18 | 10.00 | 12.08 | 18.6% | 3 |
| 2026 | Net income (GAAP) | 1,967 | 1,748 | 2,095 | 17.6% | 5 |
| 2026 | EPS (normalized) | 8.31 | 7.84 | 9.07 | 14.8% | 4 |
Source: Visible Alpha consensus via S&P Xpressfeed · Consensus as of 2026-07-10 · generated 2026-07-19.
Model trust
That is current rather than stale, but a five-broker peak is a modest panel — read it as a small analyst set rather than deep consensus, and note that coverage thins to two brokers or fewer on several KPI and cash-flow lines.
Base currency: CNY · VA scales normalized from Abs, M; item currencies and units retained · Coverage depth and vintage; broker count is the maximum represented.
| Brokers | Line items | Last revision |
|---|---|---|
| 5 | 301 | 2026-07-10 |
Operating KPIs
Base currency: CNY · VA scales normalized from Abs, M; item currencies and units retained · FY-1A / FY0E / FY+1E; broker count shown per KPI.
| Operating KPI | Source | FY-1A | FY0E | FY+1E | Brokers |
|---|---|---|---|---|---|
| Accounts receivable | CD | 2,515,341.87bn Amount | 1,747,266.07bn Amount | 1,787,391.33bn Amount | 5 |
| Cash and cash equivalents | CD | 5,263,104.36bn Amount | 6,701,693.64bn Amount | 8,636,428.42bn Amount | 5 |
| EPADS - Diluted(CNY) | CD | 9.75 Amount | 7.70 Amount | 9.43 Amount | 5 |
| Funds payable to investors of consolidated trusts | CD | 1,102,250.58bn Amount | 1,223,014.03bn Amount | 1,450,439.43bn Amount | 5 |
| Income tax expenses | CD | 552,659.17bn Amount | 408,707.01bn Amount | 489,029.79bn Amount | 5 |
| Loans receivable, net | CD | 6,147,401.06bn Amount | 7,232,186.98bn Amount | 8,275,954.13bn Amount | 5 |
| Net profit attributable to PPDai Group Inc | CD | 2,559,800.98bn Amount | 1,948,678.00bn Amount | 2,341,485.54bn Amount | 5 |
| Net profit/(loss) | CD | 2,575,798.56bn Amount | 1,966,128.94bn Amount | 2,360,489.97bn Amount | 5 |
| Net profit/(loss) attributable to non-controlling interest shareholders | CD | 15,997.59bn Amount | 17,450.94bn Amount | 23,755.53bn Amount | 5 |
| Non-operating revenue/(expenses) | CD | 201,561.00bn Amount | 16,249.32bn Amount | 122,895.64bn Amount | 5 |
| Operating profit/(loss) | CD | 2,932,656.90bn Amount | 2,358,586.62bn Amount | 2,775,782.37bn Amount | 5 |
| Other income, net | CD | 201,561.00bn Amount | 16,249.32bn Amount | 122,895.64bn Amount | 5 |
P&L bridge
Base currency: CNY · VA scales normalized from Abs, M; item currencies and units retained · Margins are derived against revenue; YoY compares adjacent fiscal columns; broker count shown per line.
| P&L line | FY-1A | FY0E | FY+1E | Brokers |
|---|---|---|---|---|
| Revenue | 13,439,286.47bn Amount | 12,708,237.86bn Amount (-5.4% YoY) | 13,594,892.14bn Amount (7.0% YoY) | 5 |
| Operating Income | 2,946,421.54bn Amount (21.9% margin) | 2,411,550.53bn Amount (19.0% margin; -18.2% YoY) | 2,853,460.71bn Amount (21.0% margin; 18.3% YoY) | 4 |
| Net Income | 2,559,800.98bn Amount (19.0% margin) | 1,948,678.00bn Amount (15.3% margin; -23.9% YoY) | 2,341,485.54bn Amount (17.2% margin; 20.2% YoY) | 5 |
| Eps | 1.94 Amount | 1.51 Amount (-22.1% YoY) | 1.86 Amount (22.8% YoY) | 4 |
Consensus dispersion
Base currency: CNY · VA scales normalized from Abs, M; item currencies and units retained · Top high-low spreads relative to absolute mean; requires at least 3 brokers.
| Line item | Period | Mean | Min | Q1 | Q3 | Max | Spread / mean | Brokers |
|---|---|---|---|---|---|---|---|---|
| Non-operating revenue/(expenses) | 3QFY-2026 | 1,871.10bn Amount | -32,668.00bn Amount | -12,684.00bn Amount | 19,140.65bn Amount | 30,981.30bn Amount | 3401.7% | 3 |
| Other income, net | 3QFY-2026 | 1,871.10bn Amount | -32,668.00bn Amount | -12,684.00bn Amount | 19,140.65bn Amount | 30,981.30bn Amount | 3401.7% | 3 |
| Non-operating revenue/(expenses) | FY-2026 | 16,249.32bn Amount | -130,672.00bn Amount | -32,668.00bn Amount | 57,693.60bn Amount | 197,661.00bn Amount | 2020.6% | 5 |
| Other income, net | FY-2026 | 16,249.32bn Amount | -130,672.00bn Amount | -32,668.00bn Amount | 57,693.60bn Amount | 197,661.00bn Amount | 2020.6% | 5 |
| Non-operating revenue/(expenses) | 4QFY-2026 | -3,608.27bn Amount | -32,668.00bn Amount | -12,684.00bn Amount | 10,921.60bn Amount | 14,543.20bn Amount | 1308.4% | 3 |
| Other income, net | 4QFY-2026 | -3,608.27bn Amount | -32,668.00bn Amount | -12,684.00bn Amount | 10,921.60bn Amount | 14,543.20bn Amount | 1308.4% | 3 |
Quarterly path
Base currency: CNY · VA scales normalized from Abs, M; item currencies and units retained · Next four supplied quarters; final column is maximum broker coverage in the row.
| Quarter | Accounts receivable | Cash and cash equivalents | EPADS - Diluted(CNY) | Funds payable to investors of consolidated trusts | Income tax expenses | Total revenue | EPS Diluted, Applicable to common stockholders(CNY) | Broker coverage |
|---|---|---|---|---|---|---|---|---|
| 3QFY-2026 | 1,646,315.74bn Amount | 4,709,897.39bn Amount | 1.99 Amount | 1,173,651.72bn Amount | 109,945.32bn Amount | 3,193,045.17bn Amount | 0.40 Amount | 4 |
| 4QFY-2026 | 1,645,742.57bn Amount | 5,037,872.59bn Amount | 2.13 Amount | 1,219,512.58bn Amount | 117,220.66bn Amount | 3,218,916.49bn Amount | 0.43 Amount | 4 |
| 1QFY-2027 | 1,627,610.74bn Amount | 5,714,563.36bn Amount | 2.22 Amount | 1,249,698.61bn Amount | 121,710.19bn Amount | 3,291,198.66bn Amount | 0.44 Amount | 4 |
| 2QFY-2027 | 1,707,295.97bn Amount | 5,636,913.67bn Amount | 2.27 Amount | 1,290,567.94bn Amount | 124,702.64bn Amount | 3,389,300.00bn Amount | 0.45 Amount | 4 |
19 stale period values omitted; 7 line items fully removed.
Source: S&P Capital IQ transcripts via Xpressfeed · latest indexed call 2026-05-26 · generated 2026-07-19.
Latest call digest
FinVolution Group, Q1 2026 Earnings Call, May 25, 2026 · 2026-05-26T00:30:00
Q1 2026 call (May 25, 2026). The quarter's headline is structural rather than financial: for the first time FinVolution broke out its overseas operations as a separate reportable segment and introduced segment-level adjusted EBITDA. Prepared remarks framed a two-engine story — China as the "foundation of cash flow and stability," overseas as "the engine of growth" — against a soft, seasonally weak quarter. Group net revenue was RMB 3.2 billion (up 6% sequentially) and net profit RMB 421 million (up 1%, with management attributing the muted bottom line to FX). China transaction volume held roughly flat at RMB 38.5 billion while risk improved (vintage delinquency eased to 2.7%, day-1 to 5.2%); overseas revenue reached RMB 949 million, up 35% year-over-year.
The Q&A was less about the quarter and more about disclosure and China regulation. Management reiterated FY2026 revenue guidance of RMB 11.5–12.9 billion and detailed an active buyback (about $54 million deployed by end-April) plus a new $150 million program. The harder moments came when analysts pushed for granular overseas unit economics — APR, funding cost and default rates by market — and for a 2030 overseas EBITDA-mix target; management declined both, citing market differences and too many variables. The register stays the "clarity, not certainty" posture set the prior quarter.
Participant coverage from the latest call.
| Group | Participants | Count |
|---|---|---|
| Management | Operator; Yam Cheng — Head of Capital Markets, FinVolution Group; Tiezheng Li — Co-Founder, CEO & Vice Chairman, FinVolution Group; Jiayuan Xu — Chief Financial Officer, FinVolution Group | 4 |
| Analysts | Huanan Zhou; Yun-Yin Wang — Research Analyst, China Renaissance, Research Division; Yujie Jing — Associate, China International Capital Corporation Limited, Research Division | 3 |
Curated latest-call exchanges; one row per analyst topic.
| Analyst | Firm | Topic | What changed in Q&A |
|---|---|---|---|
| Alex Ye | UBS | Buyback pace and China marketing regulation | Asked for the forward buyback pace and the impact of the new rules on online marketing of financial products. CFO gave YTD buyback detail and a fresh $150m program; CEO called the rules a natural continuation and a net positive for compliant players over the medium term. |
| Cindy Wang | China Renaissance | China risk trend and overseas segment metrics | Pressed on whether China risk kept improving into Q2 and on overseas APR, funding cost and default rates plus the 2030 EBITDA mix. Management said April day-1 delinquency fell below 5% but declined to break out overseas metrics by market or guide 2030 EBITDA. |
| Yujie Jing | CICC | Overseas growth drivers and outlook | Asked what drives overseas now that it is profitable. CEO cited a 69% five-year transaction-volume CAGR, a data flywheel across 56 million registered users, Indonesia offline BNPL and Australia. |
Theme tracker
Themes are curator-classified across supplied calls.
| Theme | Status | Quarters mentioned | Read-through |
|---|---|---|---|
| Overseas expansion toward the 50%-by-2030 goal | persisted | Q2 2023, Q3 2023, Q4 2023, Q1 2024, Q2 2024, Q3 2024, Q4 2024, Q1 2025, Q2 2025, Q3 2025, Q4 2025, Q1 2026 | The through-line of every call; overseas revenue rose from about 16% of the group in Q2 2023 to 30% in Q1 2026, when it was first broken out as a reportable segment. |
| Shareholder returns — buyback and dividend | persisted | Q2 2023, Q3 2023, Q4 2023, Q1 2024, Q2 2024, Q3 2024, Q4 2024, Q1 2025, Q2 2025, Q3 2025, Q4 2025, Q1 2026 | Dividend policy was raised to a 20–30% payout in Q4 2024 and buybacks accelerated through the China downturn — $40.7m in Q4 2025 and $39m in Q1 2026 — with a new $150m program approved in Q1 2026. |
| AI and technology as efficiency and risk moat | persisted | Q2 2023, Q3 2023, Q4 2023, Q1 2024, Q2 2024, Q3 2024, Q4 2024, Q1 2025, Q2 2025, Q3 2025, Q4 2025, Q1 2026 | From the BLU chatbot in 2023 to roughly 120 active AI initiatives in Q1 2026, with AI agents handling 50% of early-stage overseas collections; consistently pitched as an efficiency and risk advantage. |
| China regulatory tightening | emerged | Q1 2025, Q2 2025, Q3 2025, Q4 2025, Q1 2026 | First flagged in Q1 2025, the Oct 1 2025 loan-facilitation framework drove a deliberate China slowdown; by Q1 2026 attention had moved to new rules on online marketing of financial products. |
| China asset quality and credit cycle | persisted | Q2 2023, Q3 2023, Q4 2023, Q1 2024, Q2 2024, Q3 2024, Q4 2024, Q1 2025, Q2 2025, Q3 2025, Q4 2025, Q1 2026 | A standing analyst focus; risk rose through 2H 2025 after the new rules, management says it peaked in mid-December 2025, and early indicators improved into Q1 2026. |
| Australia / developed-market entry via Fundo | emerged | Q4 2025, Q1 2026 | The Fundo acquisition marked the first developed-market entry; Q1 2026 reported migrating it onto proprietary risk infrastructure with transaction volume up 25% year-over-year. |
| Indonesia interest-rate-cap overhang | dropped | Q4 2023, Q1 2024, Q2 2024, Q3 2024, Q4 2024, Q1 2025, Q2 2025 | A recurring worry through 2024 and into 1H 2025; it dropped from the narrative after the OJK froze the fee cap in July 2025 — resolution, not deterioration. |
| Small-business-owner financing disclosure | dropped | Q2 2023, Q3 2023, Q4 2023, Q1 2024, Q2 2024, Q3 2024, Q4 2024, Q1 2025 | Quarterly small-business lending figures were a fixture of prepared remarks through Q1 2025, then dropped as the script pivoted to the two-engine and overseas-segment story; likely an emphasis shift rather than a change in the business. |
Guidance ledger
Quotes, calls, and speakers are source-verified; outcomes are curator-classified.
| Verbatim guidance | Call | Speaker | Curator outcome | Outcome note |
|---|---|---|---|---|
| “For full year 2026, we reiterate our revenue guidance in the range of RMB 11.5 billion to RMB 12.9 billion.” | FinVolution Group, Q1 2026 Earnings Call, May 25, 2026 · 2026-05-26T00:30:00 | Jiayuan Xu | pending | FY2026 not yet complete at the call date; consistent with the Q4 2025 guide for a 5%-15% revenue decline. |
| “we expect full year 2026 group revenue to decline between 5% and 15% year-over-year.” | FinVolution Group, Q4 2025 Earnings Call, Mar 16, 2026 · 2026-03-17T00:30:00 | Jiayuan Xu | pending | Restated in RMB terms as RMB 11.5-12.9bn in Q1 2026; the year is not yet complete. |
| “We now expect full year 2025 total revenue guidance to be in the range of approximately RMB 13.1 billion to RMB 13.7 billion, representing year-over-year growth of approximately 0% to 5%.” | FinVolution Group, Q3 2025 Earnings Call, Nov 19, 2025 · 2025-11-20T00:30:00 | Jiayuan Xu | kept | FY2025 group revenue came in at RMB 13.6bn (Q4 2025 call), within this range. |
| “we are reiterating our full year 2025 revenue guidance of RMB 14.4 billion to RMB 15 billion or 10% to 15% year-over-year growth.” | FinVolution Group, Q2 2025 Earnings Call, Aug 20, 2025 · 2025-08-21T00:30:00 | Jiayuan Xu | missed | Cut in Q3 2025 after the regulatory change; actual FY2025 revenue of RMB 13.6bn fell below this range. |
| “We now expect the profit contribution from our international business of no less than USD 15 million this year, up from our prior estimate of $10 million.” | FinVolution Group, Q2 2025 Earnings Call, Aug 20, 2025 · 2025-08-21T00:30:00 | Jiayuan Xu | kept | Q4 2025 reported Indonesia and the Philippines contributed over USD 15m in combined operating profit. |
| “we expect they will generate a minimum net profit of $10 million in 2025.” | FinVolution Group, Q1 2025 Earnings Call, May 21, 2025 · 2025-05-21T00:30:00 | Jiayuan Xu | kept | The international profit floor was later raised to no less than USD 15m and met in 2025. |
| “we are guiding international revenue to account for roughly 30% of our full year total.” | FinVolution Group, Q4 2025 Earnings Call, Mar 16, 2026 · 2026-03-17T00:30:00 | Jiayuan Xu | pending | A 2026 target; overseas was 30% of group revenue in Q1 2026, in line so far. |
| “Our strategic target is to build a balanced portfolio with 50% of our business coming from international markets by 2030.” | FinVolution Group, Q3 2025 Earnings Call, Nov 19, 2025 · 2025-11-20T00:30:00 | Tiezheng Li | pending | Long-term 2030 target; overseas was about 30% of revenue as of Q1 2026. |
Q&A pressure map
Question counts and firms are curator tallies; analyst coverage shown above.
| Topic | Questions | Firms | Pressure / response |
|---|---|---|---|
| Shareholder returns — buyback pace and dividend | 9 | UBS, CICC, Nomura, Credit Suisse | Raised on nearly every call; management answered consistently with specific year-to-date buyback figures, remaining authorization and the payout-ratio framework. |
| Overseas expansion, profitability and unit economics | 10 | CICC, China Renaissance, UBS, Credit Suisse, Jefferies | The most pervasive line of questioning. In Q1 2026 management declined to break out overseas APR, funding cost and default rates by market and would not guide a 2030 overseas EBITDA mix — a partial non-answer on the very unit economics analysts sought after the new segment disclosure. |
| China asset quality and the credit-cycle inflection | 8 | UBS, China Renaissance, CICC | Analysts repeatedly probed day-1 delinquency and collection trends and where the cycle turns; answers were specific on monthly data but hedged on calling a bottom. |
| China regulation impact on volume, take rate and operations | 6 | China Renaissance, UBS, CICC | Focused on the loan-facilitation rules and, latterly, the online-marketing rules; management framed each as manageable and net-positive for compliant leaders. |
| Take rate and funding cost trajectory | 6 | UBS, CICC, China Renaissance | Recurring interest in how far funding costs could fall and where take rate settles; management pointed to funding-cost improvement and a higher-quality-borrower mix. |
Language shifts
Only language evidence verified against the referenced component is shown.
| Observation | Verbatim evidence | Call ID | Component |
|---|---|---|---|
| Confidence peaked in mid-2025, before the China regulatory reset, with management leaning on record-profit framing. | “a record-breaking quarterly net profit of RMB 738 million, the highest since our transition to a loan facilitation model in 2019” | 1942901151 | 2 |
| By Q3 2025 the vocabulary turned explicitly cautionary on China regulation, naming volume, revenue and risk as at stake. | “We anticipate that full implication of these regulations in the fourth quarter could create short-term uncertainties over volume, revenue and risk metrics.” | 1970075394 | 4 |
| Q4 2025 introduced a deliberately hedged framing for the year ahead that management then carried forward. | “As we entered 2026, we do so with clarity, not certainty.” | 1988977846 | 6 |
| Q1 2026 repeated that posture verbatim and extended it, signalling continuity of a patient, defensive stance. | “clarity, not certainty, patience, not haste” | 2001071436 | 2 |
| Alongside the caution, the reporting language shifted toward peer-style transparency with a new segment metric. | “We are also introducing adjusted EBITDA for each segment.” | 2001071436 | 3 |
The call history traces a clean arc: from double-digit revenue-growth guidance through mid-2025 to a guided full-year decline for 2026 as China's loan-facilitation rules bit. What has held up is the overseas engine — now profitable, about 30% of revenue and disclosed as its own segment — and an accelerating buyback. The debate the transcripts leave open is whether overseas growth and capital returns can offset a China business still working through its regulatory reset, and management's reluctance to detail overseas unit economics or a 2030 EBITDA mix keeps that question live.
FinVolution at a glance
FinVolution Group is a profitable, cash-rich online consumer-finance platform that matches Chinese and Southeast-Asian borrowers with loans funded by banks and other institutions, taking a fee and standing behind most of the credit. It earned ¥2.5 billion (about US$364 million) on ¥13.6 billion of net revenue in 2025, holds more cash and investments than debt, and yet trades near a 52-week low at roughly 3.2 times earnings and about half of book value. This chapter establishes what the business is, how it makes money, and why the market prices it as a business in decline.
FinVolution reports in renminbi (¥). Dollar figures are the company's own period-end convenience translations from its Form 20-F; the ADS trades on the NYSE in US dollars, so market value, share price, and valuation multiples are shown in dollars. Ratios and percentages are unitless.
What the company does
FinVolution began as an online consumer-lending platform in June 2007 — among the first in China — and listed on the NYSE in November 2017 under its former name, PPDAI Group; it renamed to FinVolution in 2019 but still operates its Chinese platform under the PPDai brand [1]. It is not itself the lender of record for most of its volume. It runs the technology platform, acquires and underwrites the borrower, connects that borrower to an institutional funding partner, and services the loan — earning loan-facilitation fees, post-facilitation fees, and guarantee income rather than a pure interest spread [2].
The structure a shareholder actually owns is worth stating plainly at the outset. FinVolution is a Cayman Islands holding company with no equity in its Chinese operating entities; it consolidates them through contractual variable-interest-entity (VIE) arrangements, and those VIEs generated 71.1% of total revenue in 2025 [3]. Cash held inside the PRC is subject to transfer restrictions: net assets of ¥9.3 billion (US$1.3 billion) were restricted from distribution at the end of 2025 [4]. All four co-founders sit on the board; Shaofeng Gu is Chairman and Chief Innovation Officer, and co-founder Tiezheng Li is Vice Chairman and Chief Executive Officer [5].
The scale of the platform
Net revenue (¥bn, FY2025)
Net income (¥bn, FY2025)
Loans facilitated (¥bn, FY2025)
Registered users (m)
Sources: net revenue and net income, FY2025 20-F Consolidated Statements of Comprehensive Income [6]; loan volume and users, Item 4.B Business Overview [7].
FinVolution facilitated ¥200.3 billion (US$28.6 billion) of loans in 2025 across roughly 240 million cumulative registered users, of whom 187.4 million are in China [8]. These are short-duration, small-ticket consumer loans: the China outstanding balance of ¥68.3 billion against ¥186.3 billion of annual origination implies the book turns over several times a year [9].
The revenue line has grown steadily; profit has not. Net revenue rose from ¥9.5 billion in 2021 to ¥13.6 billion in 2025 — up 43% — while net income attributable to shareholders was essentially flat, ¥2.51 billion then versus ¥2.54 billion now [10]. Net margin compressed from 26.5% to 18.7% over that span. The gap is the cost of the model: as FinVolution guarantees more of the loans it facilitates, credit provisions and guarantee costs absorb a rising share of each incremental revenue dollar — a dynamic later chapters will examine, and one a reader focused on cash-flow consistency should hold onto.
Source: FY2021–FY2025 Forms 20-F, Consolidated Statements of Comprehensive Income; latest year [11].
A maturing China book and a growing overseas one
The composition of that revenue is where the operating story lives. China still supplies three-quarters of the total, but it is no longer growing: China revenue was ¥10.4 billion, ¥10.5 billion and ¥10.2 billion across 2023–2025, and China loan origination actually fell from ¥196.1 billion in 2024 to ¥186.3 billion in 2025 [12]. The overseas business is doing the growing: revenue from outside China rose from ¥2.14 billion to ¥3.33 billion (US$476 million) over the same three years, lifting its share of net revenue from 17.0% to 24.6% [13].
Source: FY2025 20-F, Item 4.B Business Overview [14].
That overseas engine is built on markets FinVolution entered deliberately: Indonesia under the AdaKami brand in 2018, the Philippines under JuanHand in 2020, and — newest — Australia under the Fundo brand in October 2025, its first developed market [15]. Whether that engine is large enough, and profitable enough, to offset a flat China book is one of the questions the report will test; the overseas outstanding balance was still only ¥2.6 billion at year-end 2025, a fraction of China's ¥68.3 billion [16].
Credit quality is the counter-signal worth naming here. The 90-day-plus delinquency rate on the China book rose from 1.98% at the end of 2023 to 2.13% in 2024 and 2.85% in 2025 [17]. A rising delinquency rate on a shrinking domestic origination base is a fact the bull case must address, because FinVolution — not the funding bank — absorbs the loss on the majority of loans it guarantees.
The balance sheet and the discount
For a value-oriented reader, the balance sheet is the reason the low multiple is worth a second look rather than a reflexive pass. At the end of 2025 FinVolution held ¥4.29 billion of cash (US$613 million) and ¥3.02 billion of short-term investments (US$431 million) against modest borrowings and a single ¥1.0 billion convertible note — leaving roughly US$861 million of net cash, close to three-quarters of the company's market value [18]. Its only meaningful debt is US$150 million of 2.50% convertible senior notes due 2030, issued in June 2025 [19]. Shareholders' equity stood at ¥16.8 billion (US$2.41 billion) [20]. The board has declared a dividend every year [21] and has steadily bought back stock, reducing the shares outstanding to about 243 million ADS-equivalents (1,216,442,834 ordinary shares) at the end of 2025 and roughly 236 million by March 2026.
Market cap (US$bn)
Trailing P/E (x)
Price / book (x)
Net cash (US$bn)
Source: derived from the FY2025 20-F Consolidated Balance Sheets and Statements of Comprehensive Income [22] [23], and NYSE market data.
At roughly US$4.78 per ADS on about 243 million ADS outstanding, the market values FinVolution at about US$1.16 billion — some 3.2 times trailing net income of US$364 million, about 0.48 times book value, with net cash of US$861 million equal to nearly three-quarters of that market value. Put differently, the market ascribes little value to a platform that facilitated US$28.6 billion of loans and generated US$364 million of profit last year.
The stock the market has marked down
Source: NYSE market data (FINV), as reported; year-end closing prices.
FinVolution priced its IPO at US$13 in November 2017. The shares more than halved within a year, bottomed near US$1.30 in 2020 as China's regulators dismantled the peer-to-peer lending model FinVolution was built on, and have since traded in a US$3–7 band without recovering the IPO price. Over the twelve months to July 2026 the ADS fell about 52%, from roughly US$10 to US$4.78, and now sits near its 52-week low — a decline steeper than any deterioration in the reported fundamentals, which is what makes the name a candidate worth the work rather than a simple falling knife.
The question this report examines
FinVolution presents a genuine contradiction: a business earning US$364 million a year, carrying net cash worth nearly three-quarters of its market value and buying back its own stock, priced at 3.2 times earnings and below book. That price is not obviously wrong. The China loan book is flat and its delinquencies are rising; the fast-growing overseas business is still only a quarter of revenue; and the whole enterprise is a China-based consumer lender held through a VIE, exposed to PRC regulation and to the delisting and capital-transfer risks that discount every China ADR.
This report tests whether FinVolution's low-single-digit earnings multiple and below-book valuation are a durable margin of safety in a profitable, cash-generative platform, or a value trap in which a maturing China loan book with rising delinquencies, an overseas business still a quarter of revenue, and the regulatory and VIE overhang carried by every China ADR keep the discount permanently in place. The chapters that follow test the two sides of that question against the evidence — the economics of the guarantee model, the durability of the moat, the governance and ownership picture, the shape of the industry, and what the price implies.
The economics of the guarantee model
FinVolution's guarantee income of RMB4,124.9m (30.4% of 2025 net revenue) nets just RMB662.6m after the credit losses on the same book — about 21% of pretax profit and a figure released from a loss liability the company itself estimates — in a company where insiders control 91.2% of the vote (Gu alone 66.4%) on 53.6% of the economics, and hold no annual meeting. [1] [2] [3] [4] [5] [6].
The sensitivity sits in that self-estimated release. If the loss estimate behind the guarantee proved about 20% too optimistic, roughly RMB130m of the RMB662.6m net contribution would reverse — about 4% of the RMB3,101.4m of pretax profit — and the founders, who hold 53.6% of the economics, would absorb that hit alongside minority holders [7], Consolidated Statements of Comprehensive Income — p.166").
Two facts cut the other way, and they sit in the same ledger. Disclosed related-party flows run under 0.3% of revenue, so the control has not been used to route cash to insiders [8], Note 11 Related Party Balances and Transactions — p.208"); and provision coverage climbed from 465% to 543% between the first and second quarters of 2025, which reads as an estimate managed conservatively rather than stretched [9].
Reported profit converted to operating cash at about two-thirds over 2022–2025; the gap traces to a growing on-balance-sheet loan book and the working-capital intensity of the guarantee model, not to earnings that never arrive.
Figures are in renminbi (¥), FinVolution's reporting currency, with the company's own period-end US$ convenience translations from its Form 20-F where useful. Ratios and percentages are unitless. FX conversion tables were not supplied for this run, so a separate US-dollar edition is not produced.
What "guarantee income" actually is
For most of the loans it facilitates, FinVolution does not simply match a borrower to a bank and step aside. It stands behind the credit. Under its quality-assurance commitment, when a borrower funded by an institutional partner defaults, a guarantee company — third-party or one inside the group — repays the partner, and FinVolution is then obligated to reimburse that guarantee company for the same amount [10].
That promise creates two entries at the moment a loan is written, both governed by US accounting standards. One is deferred guarantee income, the fair value of the stand-ready obligation, released into revenue over time as the risk runs off [11]. The other is the liability from quality-assurance commitment, set at the expected lifetime credit losses of the covered loans — a figure derived from historical default experience, current conditions, and macroeconomic forecasts [12]. Guarantee income is the release of the first; the cost of the second flows through the income statement as credit losses. Both are management's estimates before they are anything else.
The mechanics are visible in the rollforward. The line "Release of quality-assurance obligations upon repayment" in the deferred-income schedule matches the "Guarantee income" line on the income statement to the thousand — ¥4,124.9 million in 2025 [13]. Behind that net figure sit gross flows an order of magnitude larger: the company paid out ¥7.7 billion to make partners whole in 2025 and recovered ¥4.3 billion from delinquent borrowers [14].
Source: FY2025 20-F, Note 2(s) deferred guarantee income and quality-assurance commitment rollforward [15].
Two balances are shrinking. Deferred guarantee income fell from ¥1,882 million at the end of 2023 to ¥1,119 million at the end of 2025, and the quality-assurance liability from ¥3,306 million to ¥2,575 million [16]. Management attributes the decline to a "decreased proportion of loans bearing credit risk in China," partly offset by more risk-bearing volume overseas [17]. The company is, deliberately, carrying less of its own China credit risk on its books than it used to.
The guarantee book is a thin, credit-sensitive layer
Guarantee income looks large — ¥4.1 billion, roughly 30% of net revenue — but it is not 30% of the profit. Against the credit losses booked on the same commitment, the guarantee income leaves a net contribution that is modest and volatile.
Source: FY2025 20-F, Consolidated Statements of Comprehensive Income — guarantee income and credit losses for quality-assurance commitment [18].
In 2023 the guarantee book was essentially breakeven: ¥4,479.0 million of income against ¥4,422.8 million of credit losses, a net ¥56 million [19]. By 2025 it earned ¥663 million as losses fell faster than income — about a fifth of the ¥3,101 million pretax profit [20]. Across all credit costs — the quality-assurance losses plus provisions for loans receivable and for accounts receivable — total credit charges of ¥4,526 million in 2025 exceeded guarantee income of ¥4,125 million [21].
The profit engine, then, is fees, not the guarantee. Loan-facilitation and post-facilitation service fees together were ¥6,806 million in 2025, with net interest income of ¥1,336 million; the guarantee layer sits on top as a small, swing contribution whose sign depends on how well the loss estimate holds [22]. That is why the group's net margin compressed even as revenue grew — the same dynamic the Business and Discount chapter flagged: rising credit charges absorb an outsized share of each incremental revenue dollar.
Profit converts to cash at about two-thirds
For a lender that guarantees its book, the more important test is whether the estimated profit shows up as cash. Over the last four years it has, partially. Operating cash flow trailed net profit in three of four years, and equaled it in none but 2024.
Sources: net profit, FY2025 20-F Statements of Comprehensive Income [23] and FY2022 20-F [24]; operating cash flow, FY2025 20-F cash-flow summary [25] (2022 figure restated per note below).
Cumulatively, FinVolution generated ¥6.36 billion of operating cash on ¥9.60 billion of net profit across 2022–2025 — a 66% conversion rate. The single weakest year, 2022, converted just 10% [26]. Three structural gaps explain most of the shortfall, and none of them is a sign that the profit is fictional.
First, a large slice of revenue is non-cash at the operating line. "Net interest income" earned on loans FinVolution originates and holds itself — through consolidated trusts and its overseas books — is recognized as a "net gain from investment in loans" and then removed from operating cash flow, because the actual cash for those loans is classified as investing activity. That reversal was ¥1,336 million in 2025 [27]. The company deployed ¥18.4 billion into these loans and collected ¥16.8 billion back during the year — real cash generation that never touches the operating-cash line [28]. As this on-balance-sheet book grows, reported operating cash understates the group's economic cash flow.
Second, the guarantee model is working-capital intensive. Growth requires posting security deposits with funding partners and building quality-assurance receivables, both of which consume cash as volume expands. In 2022 that drag was acute: a ¥914 million build in quality-assurance receivable and a ¥1,153 million increase in prepaid expenses and other assets — chiefly security deposits — pulled operating cash down toward zero even as profit held near ¥2.3 billion [29]. When that cycle reverses, as it did in 2024, operating cash can exceed profit — a ¥1.7 billion release from prepaid assets drove the 121% conversion that year [30].
Third, the timing of the guarantee accruals themselves — releases of deferred guarantee income and changes in the quality-assurance liability — and rising deferred-tax assets move the operating line year to year without changing the underlying economics [31].
One point on comparability: in the fourth quarter of 2024 FinVolution reclassified certain customer-funds flows between financing and investing activities and restated prior years, which is why 2022 operating cash appears as ¥236.9 million in the latest filing versus ¥268.8 million as originally reported [32]. The change did not touch the profit-to-operating-cash relationship, and the operating figures shown above are on the restated basis.
That the profit is cash-taxed is a useful check against the worry that it is an accounting mirage: FinVolution paid ¥963 million of income tax in cash in 2022, more than double its book tax expense that year, as earlier deferrals unwound [33].
Where the estimate gets tested
The durability of this profit rests on whether the loss estimate embedded in the guarantee liability proves right. That estimate is now being pressed. The 90-day-plus delinquency rate on FinVolution's China book rose from 1.98% at the end of 2023 to 2.13% a year later and 2.85% at the end of 2025 — a 44% increase in the delinquency ratio over two years [34].
Source: FY2025 20-F, Loan Performance Data — 90 Day+ Delinquency Rate [35].
Because guarantee income is fixed at the loan's inception while credit losses accrue against actual performance, worsening delinquency squeezes the guarantee book's thin margin first and the group's reported profit next — the mechanism behind the multi-year margin compression. The case is most sensitive to how the reserved estimate holds: if realized losses run above it, provisions rise and profit falls; if the estimate proves conservative, the reverse. The leading indicators behind that estimate — early-stage delinquency, vintage loss, and collection trends — are treated in Credit Quality.
Two facts weigh against reading the rising delinquency as an unmanaged deterioration. Management has publicly tightened underwriting — cutting exposure to lower-quality acquisition channels, trimming credit limits for higher-debt borrowers, and deploying earlier-stage AI collection — and has built a reserve buffer: it disclosed a provision-coverage ratio of 543% in the second quarter of 2025, up from 465% a quarter earlier [36]. And the ¥4.3 billion of gross recoveries collected in 2025 shows the collection machinery behind the estimate is real, not notional [37].
The read that fits the evidence: FinVolution's profit is real and cash-taxed, but it is estimate-dependent and credit-sensitive in a way a fee-only platform's is not, and it converts to operating cash at roughly two-thirds because the model funds its own growth in working capital and on-balance-sheet loans. What would change the read is the delinquency trend against the reserve: a coverage ratio that holds or rises while losses stay inside the reserved estimate would confirm the profit is durable; a coverage ratio that falls as delinquency climbs would mark the estimate — and the profit built on it — as too optimistic.
China credit quality through the 2025 cycle
Reported and forward credit signals point opposite ways. The 90+ delinquency rate that anchors the bear case is a lagging, shrinking-denominator measure still rising to 3.11%, while FinVolution's leading indicators — day-1 delinquency, cohort vintage loss and collection rate — peaked in mid-December 2025 and have improved every quarter since.
The two readings carry different weight on the income statement. The lagging side is where reported profit actually moves: the 90+ ratio rose from 2.85% to 3.11% over the year to March 2026, and the first-quarter-2026 provision for loans receivable more than doubled, from ¥85.4 million to ¥218.1 million. The leading side has turned the other way: day-1 delinquency ran 5.5% to 5.2% and below 5% by April, expected vintage loss eased from 3.0% to 2.7%, and the 30-day collection rate recovered from 85.9% to 86.8%. The strongest fact against the constructive read is its age — it is only two quarters old, and management itself called the November move "too early to draw a conclusion."
Figures are in renminbi (¥), FinVolution's reporting currency, with the company's own period-end US$ convenience translations from its Form 20-F where useful. Ratios and percentages are unitless. FX conversion tables were not supplied for this run, so a separate US-dollar edition is not produced.
Why credit risk lands on FinVolution's income statement
For most loans it facilitates in China, FinVolution keeps the credit risk rather than passing it to the funding bank — the quality-assurance mechanism examined in Guarantee Economics. The consequence for this chapter is direct: loan losses are not a footnote, they are the largest cost the company carries. In 2025, credit losses for the quality-assurance commitment (¥3,462.4 million), the provision for loans receivable (¥637.7 million) and the provision for accounts receivable and contract assets (¥426.0 million) together came to roughly ¥4.5 billion of charges [1] — more than the ¥4,124.9 million of guarantee income booked the same year [2]. Where delinquency goes, near-term earnings follow. That is why the credit trajectory, more than volume or take rate, is the cost line most likely to move 2026 profit.
The lagging measure keeps rising
FinVolution's most-quoted asset-quality number is the 90+ day delinquency rate: the balance of China loans it bears risk on that are 90 to 179 days past due, as a share of the risk-bearing book. Loans 180 days or more overdue are treated as charged off and drop out of the ratio [3]. It has risen every year since 2023 and kept climbing into 2026.
Source: 90+ rates for Dec-2023 to Dec-2025 from FY2025 Form 20-F, Loan Performance Data [4]; March-2026 print from the Q1 2026 results release [5].
Two mechanics make this stock measure a poor read on what new lending is doing. First, it lags: a loan written today does not enter the 90+ bucket for at least three months, so the ratio reports underwriting decisions made two to three quarters earlier. Second, the denominator is shrinking. FinVolution has been pulling back its China risk-bearing book — the quality-assurance receivable fell from ¥1.6 billion at end-2024 to ¥1.3 billion at end-2025 [6] — so a roughly steady stock of seasoned bad loans becomes a larger percentage of a smaller base. Some of the rise in the ratio is arithmetic, not fresh deterioration. The number is real and it is going the wrong way, but it is the rear-view mirror.
The leading signal turned in December
The forward-looking indicators tell a cyclical story rather than a structural one. Day-1 delinquency — the share of principal due that goes unpaid on its first due date — and the 30-day collection rate move months ahead of the 90+ bucket. FinVolution plots both.
Source: quarterly series 1Q23–4Q25 from the March 2026 investor presentation [7]; 1Q26 (5.2%) from the Q1 2026 earnings call [8].
The pattern is a clean cycle. Day-1 delinquency bottomed around 4.7% in the first half of 2025, with the 30-day collection rate steady near 89%. Then China's mid-2025 consumer-lending regulation — the interest-rate-cap and liquidity tightening detailed in Overseas Engine — squeezed the industry. Management's expected vintage loss climbed from 2.5% to 2.9% in the third quarter as day-1 delinquency rose to 5.0% and the collection rate slipped to 88%, and take rate fell because credit costs rose [9]. It got worse into the fourth quarter: day-1 delinquency reached 5.5% and the collection rate fell to 86% [10].
The inflection came in December. Management reported the early risk indicators peaking in the middle of that month, with the newly originated cohort's vintage loss stabilizing around 3% [11], and day-1 delinquency trending down through January and February toward 5% [12]. By the first quarter of 2026 the improvement had carried through every metric: expected vintage loss eased from 3.0% to 2.7%, day-1 delinquency from 5.5% to 5.2%, the 30-day collection rate recovered from 85.9% to 86.8%, and the M2 flow-through rate fell from 0.77% to 0.68% [13]. Management said day-1 delinquency fell below 5% by April, back to where it sat before the shock [14].
Sources: day-1 delinquency and 30-day collection rate as plotted in the March 2026 investor presentation [15]; management's per-quarter expected vintage loss from the Q3 2025 [16], Q4 2025 [17] and Q1 2026 [18] calls.
The cohort curves say underwriting held
The strongest evidence that this is a cycle rather than a break is the vintage curve — the cumulative loss experience of each quarterly loan cohort as it ages, month by month. FinVolution's curves are strikingly tight: every cohort from the first quarter of 2022 through the third quarter of 2025 tracks to roughly 0.6% by month three, 1.9% by month six and 2.8% by month nine [19]. Measured at full 12-month maturity, the realized vintage delinquency rate was 2.84% for loans written in 2023 and 2.32% for those written in 2024 — an improvement, not a deterioration, in the quality of new lending across those two years [20].
The honest limit sits in the same table. The 2025 cohorts — the ones written into and through the regulatory shock — have only begun to season. FinVolution reports their blended vintage rate at 1.69% as of December 2025, but flags that this covers only their early months and will rise as the loans age toward the 12-month mark [21]. Management's own real-time estimate for those cohorts touched 3.0% before easing. So the underwriting record through 2024 is genuinely good, and the 2025 vintages remain unproven — their final loss is not yet knowable from the curves.
Where the reserves are moving
Total credit charges actually fell in 2025, which is easy to misread. Credit losses for the quality-assurance commitment dropped 24.5%, from ¥4,587.3 million to ¥3,462.4 million — but the company is explicit that this reflects a smaller risk-bearing book in China, not lower losses per loan [22]. At the same time the provision for loans receivable nearly doubled, up 99.3% to ¥637.7 million, as FinVolution held more loans on its own balance sheet: loans receivable grew 55.7%, from ¥4.2 billion to ¥6.5 billion [23].
Source: FY2025 Form 20-F, Results of Operations [24]; year-on-year drivers on p.117 [25].
The signal is a shift in where the risk sits. As FinVolution shrinks the off-balance-sheet guarantee book and grows the on-balance-sheet portfolio, the on-balance-sheet provision line is where deterioration shows up first and most visibly. The first quarter of 2026 makes the point: the provision for loans receivable was ¥218.1 million, against ¥85.4 million a year earlier — up more than two and a half times — as the held loan balance rose [26]. Part of that jump is a bigger book; part is a higher loss rate on it. Group net profit fell to ¥421.1 million in the quarter, from ¥737.6 million, and credit charges were the largest reason [27].
A sector event, in peer context
The 2025 deterioration was not FinVolution-specific. Qifu, the scale leader in the peer set, saw its 90+ delinquency rate move the same way — 2.35% in 2023, down to 2.09% in 2024, then up to 2.71% in 2025 — and attributes the increase directly to the industry-wide liquidity squeeze that followed China's 2025 interest-rate-cap measures [28]. X Financial fared far worse: its 91-to-180-day delinquency rate jumped from 2.48% to 6.31% across the same window [29].
Sources: FinVolution 90+ rate from FY2025 Form 20-F [30]; Qifu from its FY2025 Form 20-F [31]; X Financial 91–180-day rate from its FY2025 Form 20-F [32].
FinVolution sits in the middle of that range: modestly worse than Qifu on the same headline number, far better than X Financial. The deterioration reads as a cyclical, policy-driven event that hit the whole China consumer-lending industry, and FinVolution absorbed it in line with the better-run half of its peers. FinVolution did not crack in the downturn; the company-specific question is whether the early-2026 recovery in its leading indicators sustains.
The constructive read and its limit
The evidence points to a credit cycle that peaked around December 2025 and has been improving since: the vintage curves show no break in underwriting through 2024, day-1 delinquency and collection rates have recovered two quarters running, and the deterioration was a shared industry event rather than a FinVolution failure. The strongest fact against that read is that the constructive case is only two quarters old, on management's own telling — the company itself called the November move "too early to draw a conclusion" [33] — while the 90+ ratio and the on-balance-sheet provision, the numbers that actually hit reported profit, are still rising because they lag.
Three credit-specific markers would decide it, each a line an investor can check in the next two filings: whether day-1 delinquency holds below the ~5% pre-shock level rather than re-accelerating; whether the 2025 cohorts season out near the 2.7% expected rate or drift toward the 3.0% that management briefly flagged; and whether the 90+ ratio, which mechanically has further to climb as the shock cohorts age, tops out by mid-2026 rather than pushing higher. On the answer to those turns much of whether the discount examined in Valuation is a floor under a stabilizing book or a warning about one still rolling over.
Where the loan capital comes from
FinVolution facilitates loans it mostly does not fund itself; the money belongs to banks, consumer-finance companies and trusts it introduces borrowers to. That supply side is the half of the platform the rest of this report has not examined, and it carries its own durability test. FinVolution has already rebuilt its entire funding base once, after regulators legislated its original source out of existence, and it now draws on 115 Chinese and 18 overseas institutions on non-exclusive terms at a cost that has been falling. The counter-case is that none of those partners is contractually locked in.
Figures are in renminbi (¥), FinVolution's reporting currency, with the company's own period-end US$ convenience translations from its Form 20-F where useful. Ratios, rates and counts are unitless. FX conversion tables were not supplied for this run, so a separate US-dollar edition is not produced.
China funding partners (cumulative)
Overseas funding partners
Risk-bearing loans / equity
China take rate (Q2 2025)
Source: cumulative partner counts and non-exclusivity from FY2025 Form 20-F [1]; leverage from the Q3 2025 earnings call [2]; China take rate from the Q2 2025 earnings call [3].
From retail money to institutional money
FinVolution began in June 2007 as an online consumer-finance platform, later operating as PPDAI [4]. For its first decade the loans were funded by individual investors — retail savers lending through the marketplace, the peer-to-peer model that defined the Chinese online-lending boom and then its clean-up. That funding source was removed by regulation: FinVolution ceased facilitating new loans with individual-investor money in October 2019, and stopped funding through third-party online-lending intermediaries the following month [5]. The business (Business and Discount) took the FinVolution name in the same window.
What matters for the funding question is what came next. Since 2020, every new loan the company facilitates in China has been funded by institutional partners or its own licensed micro-loan companies, not by retail money [6]. The platform kept originating at scale through the switch: China loan volume was ¥186.4 billion in 2023, ¥196.1 billion in 2024 and ¥186.3 billion (US$26.6 billion) in 2025 [7]. A platform that can lose 100% of its funding source and rebuild volume within a year has demonstrated what a facilitation model most needs to prove — that its value to borrowers survives a change in who holds the paper. For a reader who will not own a business that could go bankrupt, that history is the most direct evidence the funding side is not a single point of failure.
A diversified, non-exclusive partner base
The rebuilt base is broad and still widening. Cumulative Chinese funding partners rose from 88 institutions by the third quarter of 2023 to 110 at the end of 2024 and 115 by the end of 2025; overseas partners reached 18 [8] [9] [10].
Source: Q3 2023 count from the Q3 2023 earnings call [11]; year-end 2024 from the FY2024 Form 20-F [12]; Q1 2025 from the Q1 2025 earnings call [13]; year-end 2025 from the FY2025 Form 20-F [14].
The partners span commercial banks, internet and private banks, consumer-finance companies, micro-loan companies and trust-management companies [15]. Breadth cuts the risk that any one institution's withdrawal strands the platform, and FinVolution does not disclose — nor, on these numbers, does it appear to run — a dependence on a single dominant funder.
The offsetting fact sits in the same filing: the cooperation is not exclusive [16]. A partner that finds a cheaper or lower-risk channel can move borrowers there, and the same non-exclusivity that lets FinVolution add 27 partners in two years lets any of them leave. Diversification lowers the cost of one departure; it does not create a contractual lock. The company's stated defence is commercial rather than legal — offering attractive risk-adjusted returns and integration tools to keep partners engaged [17].
Falling funding cost is doing the work in the take rate
The economics of a facilitated loan sit inside a fixed ceiling. FinVolution's average China borrowing rate has held near 22% — 22.2% in the second quarter of 2024 — because the industry operates under interest-rate caps that leave little room to charge borrowers more [18]. Within that ceiling, the company's revenue take rate — what it keeps after funding cost, credit cost and expenses — has climbed from 3.1% in the second quarter of 2024 to 3.4% by mid-2025 [19] [20].
Source: Q2 2024 take rate from the Q2 2024 earnings call [21]; Q4 2024 to Q2 2025 from the Q1 2025 and Q2 2025 earnings calls [22] [23].
With the borrower rate fixed, that improvement came from the funding side, not from the customer. Funding cost fell 90 basis points in the second quarter of 2024 and continued in roughly 10-basis-point steps through 2025 [24] [25]. Management's explanation is that lenders re-price the platform's assets as they accumulate evidence of quality: as more institutions recognise FinVolution's asset quality, they lend to it more cheaply [26]. That is a real advantage of scale and track record, but a modest one — the gains are measured in basis points and the take rate has plateaued at 3.4%. The lever cuts both ways: in a tighter liquidity environment the same partners would demand a higher return, and with the borrower rate capped, that cost would land on FinVolution's take rate rather than the borrower's bill [27].
Two funding models, and a book that keeps shrinking against equity
The 115 partners are funded under two different arrangements, and the distinction governs how much risk sits on FinVolution's own balance sheet. For a substantial majority of the loans, FinVolution provides a quality-assurance commitment — it guarantees repayment to the funding partner and therefore keeps the credit risk, the mechanism dissected in Guarantee Economics [28]. Alongside it runs a capital-light model, launched in 2020, under which FinVolution acts purely as a technology enabler, earns a service fee set as a percentage of the partner's loan pricing, and assumes no credit risk at all [29].
The mix has been shifting toward the lighter model, and the company's own leverage measure shows it. FinVolution tracks a leverage ratio defined as risk-bearing loans divided by shareholders' equity; it fell from 4.3x in the second quarter of 2023 to 2.7x by the first quarter of 2025 and to a stated historical low of 2.4x by the third quarter of 2025, alongside a 570% provision-coverage ratio and ¥7 billion of cash and short-term investments [30] [31] [32].
Source: Q2 2023 leverage from the Q2 2023 earnings call [33]; Q1 2025 from the Q1 2025 earnings call [34]; Q3 2025 from the Q3 2025 earnings call [35].
A falling ratio means the risk-bearing book is shrinking relative to the equity standing behind it — the balance sheet is carrying less of the platform's volume, not more. That is consistent with the deleveraging read the closing chapter reaches for the solvency question, and it is the mechanical reason the platform can keep growing facilitated volume while the on-balance-sheet risk recedes.
The regulatory frame around the funding relationship
The relationship between platform and funder is itself regulated, and the rules moved in 2025. On 1 April 2025 China's financial regulator issued a notice tightening the management of commercial banks' internet loan-facilitation business, effective 1 October 2025; management described it as the first regulation to clearly define the loan-facilitation model — loans issued by licensed financial institutions through external third-party platforms [36]. The near-term response was defensive: in the fourth quarter of 2025 FinVolution prioritised risk control over origination, tightening underwriting and accepting a moderation in China loan volume [37].
A longer-standing rule cuts closer to the guarantee-based half of the model. Circular 141 bars banks, trusts and consumer-finance companies participating in loan facilitation from accepting credit-enhancement services — including commitments to assume default risk — from third parties [38]. FinVolution channels its quality-assurance commitment through licensed financing-guarantee subsidiaries to stay inside such restrictions, but the direction of regulation is toward separating the funder's credit decision from the platform's guarantee. Taken to its conclusion, that pressure pushes the model toward the pure capital-light service-fee arrangement — lower risk, but also a lower take rate than the guarantee model earns.
The weight of the evidence is that FinVolution's funding base is more resilient than a value-trap reading of the discount assumes: it survived the total loss of its original source, rebuilt into a broad, non-exclusive, cheapening institutional pool, and now runs its risk-bearing book at a record-low multiple of equity. The strongest fact against that read is that the resilience is commercial, not contractual — no partner is locked in, and the October 2025 re-regulation of bank loan-facilitation reshapes the very relationship the model depends on. What would change the read is direct and observable in the quarterly disclosure: partner attrition, or a reversal in funding cost showing up as a falling take rate, would signal the supply side turning from tailwind to constraint.
Overseas Engine
FinVolution now runs two businesses with opposite trajectories. The China platform is a maturing, high-margin book in managed decline; the overseas platform — Indonesia, the Philippines and, since October 2025, Australia — is growing fast and, as of the first quarter of 2026, is disclosed as a separate reportable segment for the first time. That disclosure settles a question earlier chapters could only flag: overseas is 29.6% of revenue but earns a 4.8% operating margin against China's 27%, so it adds tens of millions of profit while China sheds hundreds.
The revenue map has tilted toward Asia beyond China
Geographic disclosure begins in FY2021, and the shift since is steady rather than sudden. Revenue from outside the Chinese mainland rose from about RMB0.83 billion in 2021 to RMB3.33 billion in 2025 — from 8.7% of the group to 24.6% — while China revenue was essentially flat across the five years and dipped in 2025 [1] [2].
Source: FY2025 Form 20-F, Note 22 Geographic information (2023–2025) [3]; FY2023 Form 20-F for 2021–2022 [4]. Overseas = total less the PRC.
By 2025 the two components were pulling apart on volume as well as revenue. Full-year loans facilitated in international markets reached RMB14.0 billion, up 38.6%, while China volume fell 5.0% to RMB186.3 billion and the group total slipped 2.9% to RMB200.3 billion [5]. Within the overseas total, the Philippines is the fastest riser — revenue there grew from RMB0.25 billion in 2023 to RMB1.19 billion in 2025 — with Indonesia the larger but slower base at RMB2.04 billion [6].
Two segments, two margins
The first-quarter 2026 release is the inflection in disclosure. Management began "reporting our overseas business as a separate reportable segment," and the segment table puts hard numbers on a gap that was previously only inferable [7]. Overseas earned RMB948.9 million of net revenue — 29.6% of the group — but only RMB45.8 million of segment operating profit. China earned RMB598.7 million of operating profit on RMB2,216.1 million of revenue [8].
Source: derived from Q1 2026 Selected Segment Information (China margin = RMB598.7m / RMB2,216.1m; overseas = RMB45.8m / RMB948.9m; prior-year comparatives recast) [9].
The direction of travel inside each engine matters as much as the levels. Overseas operating profit rose 87.7% year on year, from RMB24.4 million to RMB45.8 million, and its margin widened from 3.5% to 4.8% [10]. Over the same quarter China's operating profit fell 34.4%, from RMB913.1 million to RMB598.7 million, as tighter underwriting cut volume 21.6% [11] [12]. The arithmetic of the "two-engine" framing does not yet net out on current numbers: the overseas engine added about RMB21 million of operating profit while the China engine gave back about RMB314 million, so group operating profit fell 38% to RMB546.8 million and net profit fell to RMB421.1 million from RMB737.6 million a year earlier [13].
Overseas share of revenue
Overseas share of operating profit
Overseas operating margin
Source: Q1 2026 Selected Segment Information; overseas operating profit RMB45.8m is 8.4% of group operating profit RMB546.8m [14].
High yield paid for with high cost
The overseas book carries a much higher revenue take per unit of lending. Across full-year 2025, international revenue of RMB3.33 billion on RMB14.0 billion of volume implies roughly RMB0.24 of revenue for every RMB1 originated; the China book generated RMB10.24 billion on RMB186.3 billion, closer to RMB0.055 [15] [16]. Two things drive the roughly four-fold gap, and both cut against reading it as pure margin. Overseas loans are short and high-rate — the Indonesia book runs a three-to-four-month tenor, so the same principal is re-lent several times a year and each cycle books fee revenue [17]. And a large part of China volume now passes through a capital-light model that carries no principal risk and a thinner take — RMB15.5 billion of the first quarter's China volume [18].
The high revenue yield does not survive to the operating line because acquiring and collecting from overseas borrowers is expensive and the base is still being built. Overseas unique borrowers more than doubled year on year in the first quarter, to 4.5 million, and cumulative overseas borrowers reached 13.4 million, up 76.3% [19] [20]. Growth that fast means heavy user-acquisition and collection spend landing ahead of the revenue it eventually earns, which is why the segment converts a 24%-of-volume revenue yield into a mid-single-digit operating margin. The margin has moved the right way — 3.5% to 4.8% in a year — but it has a long way to climb before it resembles the mature China book.
Where the regulation is heading
The economics that make overseas lending lucrative are the same ones regulators across the region are compressing, and the case is most sensitive to overseas operating margin. In Indonesia, the OJK set a schedule to cut the daily interest-rate cap on consumptive fintech loans from 0.4% in 2023 toward 0.1% by 2026; at the end of 2024 it replaced the uniform cut with tenor-based caps — 0.3% for loans of six months or less, 0.2% above that [21]. Because AdaKami's loans sit inside the six-month band, that revision is a reprieve rather than a cut to 0.1%. The Philippines moved the other way: a securities-regulator memorandum effective April 1, 2026 imposes a 12% monthly cap on effective rates for small loans up to PHP 10,000 [22]. And enforcement is live, not theoretical — in March 2026 Indonesia's antitrust agency fined 97 online lenders for alleged rate coordination, with AdaKami assessed IDR 102.3 billion, about RMB 41.7 million, now under appeal [23].
The Australia entry reads as a deliberate answer to that pressure. FinVolution stepped into its first developed market by acquiring Fundo — 40% for AUD 16.0 million in July 2025, then the remaining 60% for AUD 33.1 million in October 2025 — a holder of an Australian Credit Licence lending to near-prime borrowers [24] [25]. A developed market carries a higher entry barrier and, management argues, more stable rules and larger, longer-dated loans than the volume-driven emerging-market model [26]. It is early — Australia sits in the "Others" line that lost money at the segment level in the first quarter — but it signals where management thinks durable overseas profit comes from.
On the China side, management's own framing is that the domestic market is mature and being run for quality rather than growth. On the third-quarter 2025 call the CEO described eighteen years spent navigating the P2P-to-facilitation transition and "several interest rate cap adjustments," and said the company had "decisively prioritized quality over quantity," raising underwriting standards and cutting sales-and-marketing spend 12% quarter on quarter [27]. The same call characterised the overseas platform as "one of the few scaled overseas platforms in our sector" [28]. That head start is real relative to peers — Chinese competitor Yiren Digital only launched its Indonesian operations in September 2025 [29] — and FinVolution reports full-year 2025 profitability in both Indonesia and the Philippines [30].
What it means for the growth half of the case
The overseas engine is genuinely scaling, now separately profitable, and improving its operating leverage — the bull evidence is the 87.7% jump in overseas operating profit and the margin moving from 3.5% to 4.8% in a year [31]. The counter is that it remains too small in profit terms to offset China's decline: overseas is 29.6% of revenue but only about 8% of operating profit, and in the latest quarter its growth replaced barely a fifteenth of the profit China gave up [32]. Full-year 2025 still showed group net profit up 6.6% to RMB2.5 billion, but the fourth-quarter and first-quarter run-rate — net profit down to RMB415.5 million then RMB421.1 million — shows the China drag reaching the bottom line [33] [34].
For the growth half of the durable-versus-trap question, the swing factor is overseas operating margin, not overseas revenue. Revenue growth is already established; what is unproven is whether a mid-single-digit margin can climb toward the China book's mid-twenties as the borrower base matures and acquisition spend normalises — and whether it can do so while Indonesian and Philippine rate caps tighten. The read that would change is a second and third quarter of overseas margin expansion that outpaces the China profit decline; the read that would harden the value-trap case is overseas margin stalling near 5% while regulation caps the yield that funds it.
The segment split now makes both readable in real time. The line to watch is the overseas operating margin in the quarterly Selected Segment Information, against the pace of the China operating-profit decline in the same table.
Competitive Position
FinVolution is a strong operator in a business with weak barriers. Set against six listed Chinese loan-facilitation peers, it is the second most profitable of the group, but its take rate, credit performance and funding are middle-of-the-pack — nothing structural separates it from rivals in its China core, where the largest peer, Qifu, earns 2.4 times its profit at a comparable loss rate. Its one durable, hard-to-copy advantage sits offshore: a multi-year overseas head start no peer has matched. On the evidence, a narrow moat.
The peer set
All six comparables run a recognisably similar model: a Cayman-listed platform that matches Chinese consumer borrowers to licensed institutional funders (banks, consumer-finance companies, trusts), takes a fee, and carries some of the credit risk through a guarantee. That shared structure is why the group is a fair mirror — and why size, not model, is what separates them.
*Lufax figures FY2025; it ran a net loss, so ROE is not meaningful and its take rate is not comparable (it is a small-business-owner and secured lender, larger-ticket than FINV's consumer micro-loans). **Lexin figures are FY2024 (its latest 20-F); all others FY2025. ROE = net income ÷ year-end shareholders' equity. Sources: FINV FY2025 20-F [1], [2], [3]; QFIN FY2025 20-F [4], [5], [6]; Lufax FY2025 20-F [7]; Lexin FY2024 20-F [8], [9], [10]; X Financial FY2025 20-F [11], [12], [13]; Jiayin FY2025 20-F [14], [15], [16]; Yiren FY2025 20-F [17], [18], [19].
Qifu is the scale leader by a distance: RMB327.1 billion of loan volume against FinVolution's RMB200.3 billion, and RMB5.99 billion of net income — 2.4 times FinVolution's RMB2.54 billion [20][21]. Below Qifu, FinVolution is the most profitable name in the group: its RMB2.54 billion tops Jiayin (RMB1.54 billion), X Financial (RMB1.46 billion), Lexin (RMB1.10 billion) and Yiren (RMB0.05 billion), and stands against a RMB1.70 billion loss at the larger Lufax [22][23][24]. That places FinVolution as a solid second — profitable, mid-scale, but not the operator others must react to.
Net income attributable to shareholders; latest fiscal year (FY2025 except Lexin FY2024). Sources as in the table above: FINV [25]; QFIN [26]; JFIN [27]; XYF [28]; LX [29]; YRD [30]; LU [31].
No structural edge in China
A moat should show up in numbers — in pricing, in credit, or in a funding cost rivals cannot match. On each of those tests FinVolution reads as competent rather than advantaged.
Pricing. Expressed as net revenue over loan volume — a rough take rate — the comparable consumer lenders cluster in a narrow band. FinVolution's 6.8% sits at the top of that band, but only just above Lexin's 6.7% and within a point of Qifu's and X Financial's 5.9%.
Derived from each company's reported net revenue and loan volume (latest fiscal year; Lexin FY2024). †Yiren's figure is flattered by non-lending revenue — roughly an eighth of its total comes from insurance brokerage and lifestyle services rather than loan facilitation. Lufax excluded (different, larger-ticket model). Sources: net-revenue and volume citations as in the peer table — FINV [32][33]; QFIN [34][35]; LX [36][37]; XYF [38][39]; JFIN [40][41]; YRD [42][43].
The narrow spread is what commoditised pricing looks like: rates are set less by any platform's brand than by the regulatory ceiling all of them face and the returns institutional funders demand. A clean loan-facilitation take rate near 7% is respectable, not a source of advantage.
Credit. On the closest like-for-like measure — the point-in-time 90-day-plus delinquency rate on the outstanding book — FinVolution again sits in the middle. Its China book ran at 2.85% at end-2025, just above Qifu's 2.71% and below Lufax's 3.4% and Lexin's 3.6% [44][45][46][47]. The remaining three report on bases that do not line up cleanly — Jiayin discloses a vintage-based M3+ rate rather than a book delinquency rate [48], and X Financial's disclosed buckets deteriorated sharply, its 91-to-180-day delinquency rate climbing to 6.31% at end-2025 from 2.48% a year earlier [49]. The read across the group is that credit is cyclically softening for everyone; FinVolution is managing it as well as the best and better than the weakest, but its underwriting is not visibly a class apart.
Funding. Every platform draws on the same pool of licensed lenders, on non-exclusive terms. FinVolution had cumulatively worked with 115 institutional funding partners in China as of end-2025 [50]; the same banks, consumer-finance companies and trusts fund its rivals, and no single partner is committed to any one platform. That is a shared, contestable input, not a proprietary one — which is why the whole group also carries credit risk on the loans it places, FinVolution included, rather than earning a pure risk-free fee [51].
The China lending economics are examined in Guarantee Economics; the point here is comparative. Nothing in pricing, credit or funding gives FinVolution an edge a well-run rival lacks. In its home market it is a good operator in a crowded, rate-capped business — which is closer to execution than to a moat.
The overseas head start
FinVolution's clearest separation from the peer set is offshore. It has built a scaled international business while the rest of the group has barely started.
Intl loan volume FY2025 (RMB bn)
Overseas share of revenue
Overseas unique borrowers (m)
FinVolution FY2025: international loan origination RMB14.0 billion (up from RMB7.9 billion in 2023), 24.6% of revenue, 5.9 million overseas unique borrowers, funded through 18 overseas institutional partners. Source: FY2025 20-F [52]; overseas revenue share per Overseas Engine.
Against that, the peer field is thin. Qifu began overseas expansion only in 2024, extending into "several overseas markets" with no overseas scale disclosed [53]. Jiayin opened an Indonesia office back in 2019 but has since disposed of its Nigeria operations and shows little overseas volume [54]. Yiren is the earliest of the followers into FinVolution's own markets, but frames the Philippines and Indonesia as businesses to "gradually expand" from a small base [55]. Lexin and X Financial were China-only in their latest filings.
Sources: FINV FY2025 20-F [56]; YRD Q4 FY2025 transcript [57]; QFIN FY2025 20-F [58]; JFIN FY2025 20-F [59]; LX FY2024 20-F [60]; XYF FY2025 20-F [61]; LU FY2025 20-F [62].
This lead is harder to copy than a China take rate. It rests on things that take years to assemble in each market: local lending licences, a repeat-borrower base (87.6% of overseas volume in 2025 came from returning borrowers), and underwriting data on populations with little formal credit history [63]. A peer entering Indonesia today starts where FinVolution stood several years and 18 funding relationships ago.
A narrow moat
The evidence points to a narrow moat. FinVolution has no structural advantage in its China core — it prices, underwrites and funds much like its rivals, and a larger peer out-earns it while reserving as conservatively. What it does have is a scaled, hard-to-replicate overseas franchise that every competitor is years behind on, and a second-place profit standing that says it executes well.
The strongest fact against calling even that a moat is size and quality of earnings. The overseas franchise, for all its lead, is still under a quarter of revenue and earns a mid-single-digit operating margin against China's high-twenties, so the durable edge is real but does not yet carry the group's profitability — the detail is in Overseas Engine. A first-mover position that does not yet earn first-mover economics is a narrow moat, not a wide one.
What would change the read in either direction is observable. What would widen the read is overseas operating margins converging toward China's as the borrower base seasons, which would turn a revenue lead into a profit moat. What would narrow it is Yiren, Qifu or a fresh entrant reaching real scale in Indonesia or the Philippines within a few years, which would show the head start was a timing advantage rather than a barrier. Both are checkable in the segment disclosures from here.
Who owns FinVolution, and who controls it
The people who run FinVolution also own it and control it. The four co-founders and the management team hold 53.6% of the shares and 91.2% of the votes; chairman Shaofeng Gu alone commands 66.4% of the vote on 36.4% of the economics, through shares that carry twenty votes each. That concentration is one reason a profitable, net-cash company trades where it does — an outside shareholder has no path to force a change. It comes paired with unusually high alignment: the same insiders return cash through dividends and buybacks and bought more stock as it fell.
Ownership figures are as of March 31, 2026, from the FY2025 Form 20-F. Financial figures are in renminbi (¥), FinVolution's reporting currency, with the company's own period-end US$ convenience translations where useful; the ADS trades on the NYSE in US dollars, so dividends, buyback prices, and share value are shown in dollars. Percentages are unitless. FX conversion tables were not supplied for this run, so a separate US-dollar edition is not produced.
The control snapshot
Insiders' economic stake
Insiders' voting power
Chairman Gu's voting power
Public ADS voting power
Source: FY2025 Annual Report (Form 20-F), Item 6.E Share Ownership [1]; Item 3 Key Information [2].
FinVolution runs a dual-class structure. Class A ordinary shares — the shares underlying the NYSE-listed ADSs — carry one vote; Class B ordinary shares carry twenty votes each and are convertible one-for-one into Class A at the holder's option, while Class A can never convert to Class B [3]. All 566.7 million Class B shares sit with the four co-founders and management. As a result the Class B block held 94.9% of the company's aggregate voting power at March 31, 2026, and a single holder — chairman and chief innovation officer Shaofeng Gu — controlled 66.4% of the vote [4]. FinVolution's guarantee income of RMB4,124.9m (30.4% of 2025 net revenue) nets just RMB662.6m after the credit losses on the same book — about 21% of pretax profit and a figure released from a loss liability the company itself estimates — in a company where insiders control 91.2% of the vote (Gu alone 66.4%) on 53.6% of the economics, and hold no annual meeting. An ADS holder owns the cash flows but not control of the company.
The ownership table
Source: FY2025 Annual Report (Form 20-F), Item 6.E Share Ownership, based on 1,180.5 million ordinary shares outstanding (613.8m Class A, 566.7m Class B) at March 31, 2026 [5] [6].
Three features stand out. First, control does not sit with the operating CEO. Tiezheng Li, the chief executive, holds 4.8% of the vote; Gu, who chairs the board and carries the chief-innovation-officer title, holds 66.4% [7]. Whoever runs the business day to day, the last word rests with the chairman. Second, the founders' economic interest is large and real: at 53.6% of the shares, roughly half of every renminbi of profit and every dollar of buyback accrues to them alongside outside holders — the incentive to grow per-share value is their own. Third, outside ownership is thin and passive: the largest non-insider holder disclosed, the Susquehanna entities, holds 7.0% of the shares but 0.7% of the votes [8].
How the buyback shifts control
The share count has been shrinking, and it shrinks in one direction only. Between March 2025 and March 2026 the Class A count fell from 700.4 million to 613.8 million — a 12.4% reduction of the public class in a single year — while the 566.7 million Class B shares held by insiders did not move [9] [10]. Buybacks retire only Class A. So each repurchase mechanically lifts the founders' share of both economics and votes without their spending a cent.
Source: FY2021–FY2025 Forms 20-F, Item 6.E Share Ownership tables [11] [12] [13] [14] [15].
The insiders' economic stake climbed from 44.0% in 2022 to 53.6% in 2026, and Gu's voting power from 63.7% to 66.4%, with little open-market buying behind the move — the float did the work. This is the double edge of a shareholder-friendly capital return under a dual-class charter. The buyback that returns cash to Class A holders also, year by year, concentrates the company further in the founders' hands. For a minority holder the practical consequence is blunt: the discount will not be closed by a proxy fight, an activist, or a takeover, because none is possible against 91% of the vote.
What the controllers do with the cash
The offsetting fact is what those controllers have chosen to do with the company's surplus. FinVolution behaves like a business run by owners who want cash out, not empire-builders.
2026 dividend per ADS ($)
Buybacks deployed, 2 programs ($M)
Insider open-market buying, 2025 ($M)
Source: FY2025 Annual Report (Form 20-F), Item 8.A Dividend Policy and Item 16E Purchases of Equity Securities [16] [17].
The board has declared a dividend every March from 2019 through 2026, and in March 2025 it formalized a policy to distribute 20% to 30% of the prior year's net income each year; the March 2026 dividend was set at $0.306 per ADS [18]. Cash dividends paid to U.S. investors rose from ¥416.5 million in 2023 to ¥510.2 million (about $73.0 million) in 2025 [19].
On top of the dividend sit two $150 million buyback authorizations — a 2023 program that retired about 27.3 million ADSs, and a 2025 program that had bought a further 18.8 million ADSs at an average $6.22 by March 2026, roughly $267 million deployed across the two [20] [21]. As the ADS fell from about $9.50 in mid-2025 toward $5.20 by early 2026, the company bought more, not less.
Source: FY2025 Annual Report (Form 20-F), Item 16E — monthly repurchases under the 2025 Share Repurchase Program [22].
Management also put its own money in alongside: members of senior management bought approximately $1.9 million of ADSs in the open market during 2025, outside the company's programs [23]. And the take is modest at the top: FinVolution paid its directors and officers as a group about ¥27.0 million ($3.9 million) in cash for 2025 — roughly 1% of net income — with no pension or retirement accruals [24]. A controlling family paying itself little, buying stock personally, and buying more as the price fell is the behavior of owners compounding value, not extracting it.
The related-party channel — small, so far
Concentrated control is a standing invitation to self-dealing, so the related-party record is worth checking directly. Two channels exist. The first is structural: FinVolution consolidates its Chinese operations through variable-interest entities whose equity is registered not to the listed company but to the four co-founders and a few of their family relatives, backed by call options and interest-free loans of ¥100 million that fund the nominees' capital contributions [25] [26]. The nominees being the controlling founders cuts both ways: it removes the risk of an unaffiliated nominee going rogue, but it concentrates the VIE conflict in the same hands that already hold the votes, and the company states plainly it cannot assure that these shareholders will resolve conflicts in its favor [27].
The second channel is operating transactions, and here the disclosed amounts are small. At the end of 2025, amounts due to related parties totaled ¥18.7 million and amounts due from them ¥36.7 million; the largest recurring item was ¥29.9 million of operation-and-support-services expense to Smart Frontier, an equity-method investee [28]. A founder-owned data provider, PPcredit, supplies data at prices the company says are set by reference to other market participants [29]. Against ¥13.6 billion of revenue these figures are rounding error — under 0.3% of the top line. On the evidence in the filings, the control has not been used to route cash to insiders; the cash has gone out as dividends and buybacks instead.
The guardrails a minority holder actually has
They are few, and they are largely self-imposed. As a Cayman Islands company and a foreign private issuer, FinVolution follows home-country practice and is exempt from the NYSE rules that would otherwise require a majority-independent board, a fully independent compensation committee, and an annual shareholders' meeting; it does not hold one [30]. Its directors, officers, and principal shareholders are also exempt from the Section 16 insider-reporting and short-swing-profit rules that apply to domestic issuers [31]. The board is seven directors, three of them independent — a minority, not a majority; the chair (Gu) and CEO (Li) titles are split, but both are co-founders, so the separation is organizational rather than a genuine independent check [32].
The read that fits the evidence: FinVolution scores poorly on governance rights and well on governance behavior. A minority ADS holder owns cash flows over which they have no vote and no exit lever, under a charter that entrenches the founders a little more with every buyback. What protects that holder is not structure but conduct — a controlling family whose own 53.6% stake ties its wealth to the same per-share value, and whose revealed pattern is aggressive, price-sensitive cash return rather than extraction. The counter-case is that the record is only a record: nothing in the structure prevents a future pivot to dilutive deals, Class B issuance, or larger related-party flows, and outside holders would have no means to stop it. The check to watch is therefore behavioral — whether related-party balances stay immaterial, whether buybacks and the 20%–30% payout continue, and whether insiders keep buying rather than selling. So long as those hold, the concentration reads as aligned control; if they break, the same concentration becomes the mechanism of a value trap.
What US$4.78 buys
At about US$4.78 per ADS, on 243.29 million ADS outstanding, FinVolution is worth roughly US$1.16 billion. Trailing net income was US$364 million, so the multiple is about 3.2 times earnings and 0.48 times book. Net cash of about US$861 million covers nearly three-quarters of the market value, which leaves the operating platform priced at roughly US$0.30 billion — below its own annual profit. This chapter sizes that discount, checks whether it is FinVolution's alone, and asks how it could pay off.
FinVolution reports in renminbi (¥); the FY2025 Form 20-F translates to US dollars at ¥6.9931 per US$1.00, the December 31, 2025 noon buying rate. Reported financials are shown in ¥, market value and multiples in the currency the ADS trades in — US$. Multiples and percentages are unitless.
The arithmetic of the discount
Trailing P/E (x)
Price / Book (x)
Net cash / market value
Enterprise value / earnings (x)
Source: derived from FY2025 20-F Consolidated Statements of Comprehensive Income [1] and Consolidated Balance Sheets [2], and NYSE market data.
The starting point is what the market pays. FinVolution reported diluted earnings of ¥9.59 (US$1.37) per ADS in 2025 on net income attributable to shareholders of ¥2,542 million (US$364 million) [3]. With 243.29 million ADS (1,216,442,834 ordinary shares) outstanding at year-end, the US$4.78 quote puts the market value near US$1.16 billion and the trailing multiple at about 3.2 times earnings. Shareholders' equity was ¥16.8 billion (US$2.41 billion) [4], which puts the ADS at 0.48 times book.
The more revealing cut is to strip out the cash. FinVolution held ¥4.29 billion of cash and ¥3.02 billion of short-term investments against about ¥1.28 billion of borrowings — roughly US$861 million of net cash — at the end of 2025 [5]. Subtracting that from the US$1.16 billion market value leaves an enterprise value of about US$302 million for a platform that earned US$364 million last year — an enterprise value near 0.8 times earnings.
Source: derived from FY2025 20-F Consolidated Balance Sheets [6] and NYSE market data; net cash = cash and short-term investments less borrowings.
On its own, a business earning US$364 million valued at about US$302 million is the kind of number that either signals mispricing or warns that the earnings are not trusted to last. The rest of the chapter separates those two readings.
A sector discount, not a single-stock one
The first test is whether the market has singled out FinVolution or marked down the whole group. It is the group. The listed Chinese loan-facilitation peers all trade at low-single-digit earnings multiples and well below book, and by mid-2026 several were cheaper than FinVolution on both measures.
Source: market data (Nasdaq/NYSE), approximate, mid-July 2026. Peer multiples are aggregator snapshots and vary by source; X Financial's sub-1x P/E reflects one-off gains, so the price-to-book column is the steadier comparison.
Two things follow. First, the discount is a sector overhang: every one of these China-based, VIE-held consumer lenders is priced at a fraction of book despite reporting profits, which points to shared causes — PRC regulatory and data risk, VIE and delisting fears, and capital-transfer doubts — rather than something specific to FinVolution. Second, FinVolution is not the cheapest name in the group; it sits at the top of the cheap band, at 0.48 times book against roughly 0.16 to 0.44 for the three peers here. That cuts against any claim that the market has uniquely mispriced FinVolution. The more defensible statement is that FinVolution carries a modest premium within a uniformly derated cohort — plausibly for its cleaner balance sheet and its overseas growth (Overseas Engine) — and that a re-rating of the ADS most likely requires the whole sector's discount to lift, not just this one stock's.
The net-cash floor and its asterisk
Nearly three-quarters of the market value in net cash is the bull's anchor, and it deserves a hard look, because cash inside China is not the same as cash a Cayman holding company can hand to ADS holders. FinVolution is explicit that it is "a holding company with no operations of its own," dependent on dividends from its PRC subsidiaries and service fees from the VIEs to fund distributions [7]. The restricted portion is large: paid-in capital, statutory reserves and VIE net assets totaling ¥9.3 billion (US$1.3 billion) were not distributable at the end of 2025, and cash held onshore "may not be available to fund operations or for other use outside of the PRC" [8].
The asterisk is real, but the record argues it is not binding today. FinVolution has in fact moved cash offshore and returned it every year: dividends on the ordinary shares "will be paid in U.S. dollars" [9], the board has declared one every March since 2019, and the US$150 million convertible notes issued in 2025 sit at the holding-company level. So the restriction is a constraint on how fast and how much, not a wall — the discount to net cash is not a claim that the cash is fictional, but a discount for the friction and the tail risk of moving it. A reader who trusts the upstreaming to continue treats the net cash as most of a floor; a reader who prices the SAFE-conversion and policy risk at more than a token haircut does not.
The earnings the multiple sits on
"3.5 times trailing earnings" flatters the entry point, because the trailing year is close to a peak and the near-term direction is down. In the first quarter of 2026 net profit attributable to shareholders fell to ¥415 million (US$60 million) from ¥746 million a year earlier — a 44% drop — as group operating profit slid to ¥547 million from ¥883 million [10]. Consensus carries that through: analysts model earnings per ADS falling about 18% in 2026, to roughly ¥8.3 from ¥10.2, before recovering to about ¥9.7 in 2027.
Sources: FY2023–FY2025 basic earnings per ADS, FY2025 20-F [11]; FY2026–FY2027, consensus estimates.
On the trough year the ADS trades near 3.7 times forward earnings, not 3.2; on the modelled 2027 recovery, back to about 3.1. Neither is expensive, but the distinction matters: this is not a business the market expects to hold its earnings flat and cheap — it is one the market expects to earn less in the year ahead, which is exactly why a low trailing multiple is not, by itself, a margin of safety. The forward decline traces to the same forces earlier chapters set out — a flat, higher-delinquency China book (Guarantee Economics) offset only partly by overseas growth. Against that, the sell-side is more sanguine than the tape: the mean analyst price target sat near US$7.3, roughly 50% above the quote, with six buy ratings and none to sell.
How the discount can pay without a re-rating
If the multiple never expands — the base case when the discount is a sector-wide overhang and there is no takeover or proxy lever to force it (the control picture is in Ownership and Control) — the return has to come from cash. Here the arithmetic is unusually direct. In 2025 FinVolution paid ¥510 million of dividends and repurchased ¥767 million of stock, about ¥1.28 billion (US$183 million) returned in one year against a US$1.16 billion market value [12].
Source: FY2025 20-F Consolidated Statements of Cash Flows [13].
The two channels behave differently, and both help the ADS holder. The dividend is set at 20% to 30% of prior-year net income; the March 2026 declaration was US$0.306 per ADS, a 6.4% yield at US$4.78 [14]. The buyback does something the dividend cannot: because it retires only Class A shares, a fixed dollar profit is spread over a shrinking count, lifting per-ADS earnings and net cash — and it accelerated as the price fell, from 3.6 million ADS at US$9.51 in June 2025 to 4.3 million at US$5.22 that December and 3.6 million at US$5.20 the next month, 18.8 million ADS in all at an average US$6.22 [15]. Buying back stock below book at a mid-teens earnings yield is accretive by construction; the more the discount persists, the more per-ADS value the repurchase transfers to holders who stay.
There is a second, softer support. The market's US$302 million enterprise value is covered several times over by the China segment's operating profit alone — that segment earned ¥599 million in the first quarter of 2026 [16] — which leaves the overseas franchise, growing and now about a quarter of revenue, valued at close to nothing. Overseas contributes little profit yet (its segment operating profit was ¥46 million in the quarter, up 88% year on year) [17], so this is an option on growth rather than a claim on current earnings — but it is an option the price does not appear to charge for.
What would decide the case
The valuation resolves the report's central question into a measurable form. The margin-of-safety reading requires three things to hold: the net cash keeps reaching shareholders (the 2019–2026 record says it has), the ~16% annual cash return continues (funded comfortably by profit, though the on-balance-sheet loan book competes for that cash, as Guarantee Economics shows), and earnings trough rather than erode. The value-trap reading needs only one to fail — most plausibly the third, if China credit costs keep rising and the overseas engine cannot offset them, or if PRC policy tightens the flow of cash offshore.
On the evidence, the discount looks more like a low-expectations, cash-returning holding than a broken one: the balance sheet is real, the cash has moved, and the buyback is accretive at these prices. What tempers that is the absence of a catalyst to close the gap — the discount is shared across the sector and the control structure rules out a takeover — so the return is likely to arrive slowly, through dividends and share shrinkage, rather than through a re-rating. The read is most sensitive to the earnings trajectory: whether 2026 earnings land near the consensus ¥8.3 per ADS (a pause) or materially below it (erosion). The first quarter's 44% profit decline is a caution, not yet an answer.
Reconciling the discount
This chapter adds no new facts. It sets the report's pillars against each other, because FinVolution's own numbers support two coherent readings: a cash-rich, owner-run platform trading well below book, and a maturing China lender whose earnings are falling and whose cheapness is a sector-wide discount with no catalyst to close it. The two readings do not disagree on the facts — they disagree on what the facts will do next. The case is most sensitive to three measurable things: the 2026 earnings path, whether the overseas business turns revenue into profit, and whether onshore cash keeps reaching shareholders.
Figures are in renminbi (¥), FinVolution's reporting currency, with the company's own period-end US$ convenience translations from its filings where useful. Ratios and percentages are unitless. FX conversion tables were not supplied for this run, so a separate US-dollar edition is not produced.
One balance sheet, two readings
The same disclosures anchor both the bull and the bear. Six facts carry most of the weight, and each is real; what separates the readings is the direction of travel each side expects.
Net cash. Cash and short-term investments of ¥7.30 billion against ¥1.28 billion of borrowings and convertible notes leave roughly ¥6.0 billion — about US$861 million — of net cash [1][2], roughly three-quarters of the ~US$1.16 billion market value examined in Valuation. The bull reads a floor that has moved — a dividend every March since 2019, most recently US$0.306 per ADS [3]. The bear reads a floor with an asterisk: FinVolution is a Cayman holding company with no operations of its own, dependent on dividends from PRC subsidiaries and service fees from the consolidated VIEs, and a large share of onshore net assets is restricted from distribution except in a solvent liquidation [4].
The multiple. At roughly 3.5 times trailing earnings and 0.53 times book, the ADS is cheap on any absolute measure. The bull notes that a buyback retiring stock below book is accretive by construction. The bear notes two things the trailing multiple hides: FinVolution is the least cheap of a uniformly derated Chinese loan-facilitation cohort, so the discount is a shared regulatory and VIE overhang rather than a stock-specific mispricing, and the trailing year sits near an earnings peak — first-quarter 2026 net profit attributable to shareholders fell 44%, to ¥415 million from ¥746 million, and operating profit fell 38% [5]. On consensus, the multiple is closer to 4 times forward earnings.
The cash return. FinVolution returned about US$182 million in 2025 — US$75 million of dividends and US$107 million of buybacks, a 50% payout of net income [6] — roughly 14% of the market value. The bull sees owners handing cash back and shrinking the share count. The bear sees a return that arrives slowly and, because the buyback retires only Class A stock, one that concentrates control in the founders while it waits (the mechanic set out in Ownership and Control).
Credit. The 90+ delinquency rate that anchors the bear case is a lagging, shrinking-denominator measure still rising to 3.11%, while FinVolution's leading indicators — day-1 delinquency, cohort vintage loss and collection rate — peaked in mid-December 2025 and have improved every quarter since [7][8]. The bull points to the leading indicators, which turned in mid-December 2025 — day-1 delinquency was back below 5% by April 2026 [9] — and realized vintage loss that improved from 2.84% on 2023-written loans to 2.32% on 2024 loans [10]. The bear points to the numbers that actually hit reported profit, which still lag the wrong way: the provision for loans receivable more than doubled year-on-year in the first quarter, to ¥218.1 million [11], and the constructive turn is only two quarters old. The full argument is in Credit Quality.
The overseas engine. Overseas reached 29.6% of first-quarter revenue and is the group's growth driver [12]. The bull sees a scaled head start over China-only peers (Overseas Engine). The bear sees revenue that has not become profit: in the quarter the overseas segment earned a 4.8% operating margin and ¥45.8 million of operating profit — about 8% of the group's ¥546.8 million — against ¥598.7 million from China [13], even as China's contribution fell year-on-year and Southeast-Asian rate caps still work through the take rate.
Control. The founders hold 91.2% of the vote on 53.6% of the economics [14]. The bull reads alignment: management behaves like owners, holds quarterly calls, and the founder CEO gives the updates. The bear reads entrenchment: dual-class voting, foreign-private-issuer exemptions from majority-independent-board and annual-meeting rules, and a structure that rules out a takeover as the mechanism that would ever close the discount.
The matrix below is the same six facts, read both ways.
Reconciliation of facts established across Valuation, Credit Quality, Overseas Engine and Ownership and Control; sources cited inline above.
Three scenarios
The readings resolve into three paths over the next two to three years. They are not equally likely, and the report does not assign probabilities; each is defined by what would have to prove true and how a holder would be paid.
In the improving case, the credit turn that began in December 2025 holds, 2026 earnings trough near the consensus ¥8.3 per ADS rather than below it, and the overseas business converts its revenue share into a materially larger slice of profit as Southeast-Asian volumes season past the rate-cap reset. Return then comes from three places: the ~6.4% dividend, a buyback that compounds per-share value below book, and, if the China-ADR overhang lifts, a narrowing of the sector discount — the component that would drive a step-change rather than slow compounding. This is the case that fits a fallen-star, near-term-pain-then-recovery setup.
In the base case, China earnings stay soft but do not collapse, overseas profit builds slowly, and the discount persists because nothing forces it to close. The holder is paid by the cash return and share-count shrinkage — a mid-single-digit yield plus buyback accretion — while the multiple stays low. This is a grind, not a re-rating, and it depends on the cash continuing to reach shareholders.
In the eroding case, the credit turn reverses as unseasoned 2025 vintages mature, or Southeast-Asian rate caps compress the overseas take rate faster than volume grows, or offshore cash flow tightens under PRC transfer friction. Earnings fall below the consensus trough, the payout — a percentage of net income — shrinks with them, and the discount is revealed as fair rather than generous. The balance sheet still cushions the equity, but the return case weakens to the value of the cash minus the friction of getting it out.
Scenario framing built on the earnings, credit and overseas evidence in prior chapters; consensus EPS of ¥8.3 per ADS for 2026 is a yfinance analyst mean (four analysts), not a filing.
The solvency question
A reader who never buys a business that could go bankrupt needs the survival question addressed directly rather than assumed away. On the balance sheet, it is the least ambiguous part of the case. Against ¥7.30 billion of cash and short-term investments, total borrowings and convertible notes are ¥1.28 billion, and shareholders' equity is ¥16.84 billion — total liabilities of ¥8.57 billion are barely half of equity [15][16]. The only meaningful debt instrument, US$150 million of 2.50% convertible senior notes, does not mature until 2030 [17]. By March 2026 the company still held ¥4.69 billion of cash and ¥2.64 billion of short-term investments [18].
Net cash, US$m (Dec-2025)
Borrowings + notes, US$m
Shareholders' equity, US$m
Liabilities / equity (x)
Net cash and equity from the FY2025 balance sheet (¥ converted at the 20-F rate of ¥6.9931/US$); total liabilities ¥8.57bn against equity ¥16.84bn [19].
What could break a lender is not its funded debt but its guarantee book: FinVolution keeps the credit risk on most China loans through the quality-assurance mechanism, so a loss shock large enough to overwhelm reserves would land on equity (Guarantee Economics). Two things bound that tail. The risk-bearing China book is shrinking by design, and the loss estimate behind it is reserved at expected lifetime losses; a shock would have to run well beyond the 2025 rate-cap event — which peers absorbed without impairment — before the ¥16.8 billion equity base was in question. The residual risk is not insolvency but access: the cash is real, but a meaningful part sits inside PRC entities and reaches an ADS holder only through the dividend and service-fee channels the holding-company structure depends on [20]. On the evidence, bankruptcy is a hard case to construct; a value-destroying failure to upstream cash is the more plausible way the floor disappoints.
What to watch
The scenarios are distinguished by data the company reports every quarter, on a call the founder CEO hosts. The signposts below are chosen to be falsifiable — each has a level that would confirm the improving read and a level that would confirm erosion — and each has a next read within a filing or two.
Signpost levels drawn from the FY2025 20-F, the Q1 2026 results and call, and the March 2026 deck, cited in the sections above; the ¥8.3 consensus is a yfinance analyst mean, not a filing.
On the durable-margin-versus-trap question, the balance sheet answers the first half — the equity is cushioned, and bankruptcy is difficult to construct — while the earnings path, the overseas margin and the offshore-cash channel decide the second. Those are measured quarterly, and the first-quarter print, a 44% profit decline against a credit turn only two quarters old, is a marker rather than a resolution.